World Fuel Services 2008 Annual Report Download - page 5
Download and view the complete annual report
Please find page 5 of the 2008 World Fuel Services annual report below. You can navigate through the pages in the report by either clicking on the pages listed below, or by using the keyword search tool below to find specific information within the annual report.-
 1
1 -
 2
2 -
 3
3 -
 4
4 -
 5
5 -
 6
6 -
 7
7 -
 8
8 -
 9
9 -
 10
10 -
 11
11 -
 12
12 -
 13
13 -
 14
14 -
 15
15 -
 16
16 -
17
-
18
-
19
-
20
-
21
-
22
-
23
-
24
-
25
-
26
-
27
-
28
-
29
-
30
-
31
-
32
-
33
-
34
-
35
-
36
-
37
-
38
-
39
-
40
-
41
-
42
-
43
-
44
-
45
-
46
-
47
-
48
-
49
-
50
-
51
-
52
-
53
-
54
-
55
-
56
-
57
-
58
-
59
-
60
-
61
-
62
-
63
-
64
-
65
-
66
-
67
-
68
-
69
-
70
-
71
-
72
-
73
-
74
-
75
-
76
-
77
-
78
-
79
-
80
-
81
-
82
-
83
-
84
-
85
-
86
-
87
-
88
-
89
-
90
-
91
-
92
-
93
-
94
-
95
-
96
-
97
-
98
-
99
-
100
-
101
-
102
-
103
-
104
-
105
-
106
-
107
-
108
 |
 |

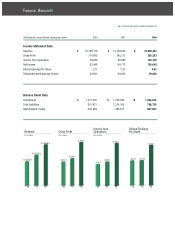
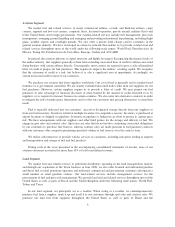
(In thousands, except diluted earnings per share) 2006 2007 2008
Income Statement Data
Revenue $ 10,785,136 $ 13,729,555 $ 18,509,403
Gross Profi t 214,069 245,272 395,383
Income from Operations 76,646 85,888 153,740
Net Income 63,948 64,773 105,040
Diluted Earnings Per Share 2.21 2.23 3.62
Diluted Weighted Average Shares 28,923 29,062 29,029
‘06
$ 10,785.1 $ 214.1
$ 76.7
$ 2.21 $ 2.23
$ 3.62
$ 85.9
$ 153.7
$ 245.3
$ 395.4
$ 13,729.6
$ 18,509.4
‘07 ‘08
FINANCIAL HIGHLIGHTS
As of, and for the year ended December 31:
Balance Sheet Data
Total Assets $ 1,277,400 $ 1,798,046 $1,404,626
Total Liabilities 851,431 1,314,169 796,739
Shareholders’ Equity 425,969 483,877 607,887
Revenue
($ in millions)
Gross Profi t
($ in millions)
Income from
Operations
($ in millions)
Diluted Earnings
Per Share
‘06 ‘06 ‘06‘07 ‘07 ‘07‘08 ‘08 ‘08