Whole Foods 2010 Annual Report Download - page 5
Download and view the complete annual report
Please find page 5 of the 2010 Whole Foods annual report below. You can navigate through the pages in the report by either clicking on the pages listed below, or by using the keyword search tool below to find specific information within the annual report.-
 1
1 -
 2
2 -
 3
3 -
 4
4 -
 5
5 -
 6
6 -
 7
7 -
 8
8 -
 9
9 -
 10
10 -
 11
11 -
 12
12 -
 13
13 -
 14
14 -
 15
15 -
 16
16 -
17
-
18
-
19
-
20
-
21
-
22
-
23
-
24
-
25
-
26
-
27
-
28
-
29
-
30
-
31
-
32
-
33
-
34
-
35
-
36
-
37
-
38
-
39
-
40
-
41
-
42
-
43
-
44
-
45
-
46
-
47
-
48
-
49
-
50
-
51
-
52
-
53
-
54
-
55
-
56
-
57
-
58
-
59
-
60
-
61
-
62
-
63
-
64
-
65
-
66
-
67
-
68
 |
 |

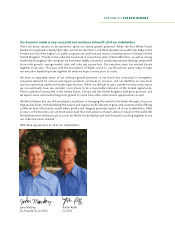
stakeholders
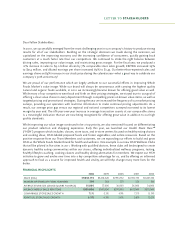
Our favorable financial position and long-term outlook gave our Board of Directors the confidence to reinstate
a quarterly cash dividend subsequent to the end of the fiscal year. The dividend of $0.10 per share will return
approximately $69 million to shareholders annually. As a company with significant future growth opportunities,
we are fortunate to have sufficient cash on hand and predictable cash flow allowing us to pay off our debt,
accelerate our new store growth, and pay a dividend to our shareholders.
The Federal Trade Commission’s (“FTC”) challenge to our merger with Wild Oats is finally over. As part of
our settlement agreement with the FTC, on July 1, we completed the sale of two former Wild Oats stores; one
non-operating store; and the associated intellectual property. We have no further obligations to the FTC and
are pleased, three years after closing the deal, to have this matter officially behind us.
We walk our talk when it comes to our core values.
Last January, we were extremely pleased to move up four spots to number 18 on Fortune’s list of the “100
Best Companies to Work For.” To be one of only 13 companies ranked thirteen years in a row validates our
commitment to our core value of ‘Supporting Team Member Happiness and Excellence.’ This was a great
achievement, and we thank our regional and store leadership teams for the great job they did staying focused
on Team Member morale in 2009, which was a very challenging year.
We also want to thank our customers and Team Members for their generosity in the wake of the tragedy in
Haiti. Our customers donated $1.8 million toward the relief and rebuilding efforts in Haiti, and our Team
Members contributed $96,000 to support our Haitian Team Members whose friends and family were affected
by the earthquake. Through the Whole Planet Foundation, Whole Foods Market provided $1 million to a
microcredit organization that provided banking services to people in Haiti following the earthquake. While not
surprised by the outpouring of cash donations, we were humbled and grateful that our customers and Team
Members contributed to help so many others in need.
In keeping with our core value of caring about our communities and the environment, we made charitable
donations of over 5% of our net after-tax profits in fiscal year 2010. In addition, our Whole Planet Foundation,
whose mission is to empower the poor through microcredit in communities that supply our stores with
product, committed grants of over $12 million to micro-lending projects in 20 countries. And, since making
the first loan through our Local Producer Loan Program in February 2007, we now have disbursed more than
$3.7 million in loans to 66 local producers across the country. We believe our leadership in and passion about
causes that are important to our communities have created a loyal core customer base aligned with our
mission and our core values.
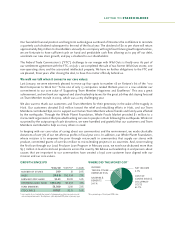
GROWTH SINCE IPO
9/26/10 9/29/91* CAGR
NUMBER OF STORES 299 10 20%
SALES $9.0 B $92.5 M 27%
EARNINGS PER SHARE $1.43 $0.08 16%
OPERATING CASH FLOW $585.3M $3.4 M 31%
TEAM MEMBERS 58,300 1,100 23%
STOCK PRICE $37.07 $2.13 16%
* 1991 results do not include the impact of subsequent pooling transactions and
accounting restatements. Stock price is split-adjusted IPO price in January 1992.
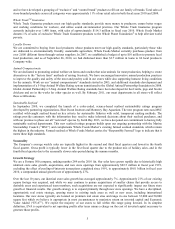
WHERE DID THE MONEY GO?
*
INCOME
TAXES & OTHER
EXPENSES 9.5%
NET INCOME
2.7%
SALARIES &
BENEFITS
24.1%
COST OF
GOODS SOLD &
OCCUPANCY
COSTS
63.7%
*As a percentage of fiscal year 2010 sales.
203719_NARR_R2.indd 3 1/11/11 2:46 PM