Whole Foods 2010 Annual Report Download - page 3
Download and view the complete annual report
Please find page 3 of the 2010 Whole Foods annual report below. You can navigate through the pages in the report by either clicking on the pages listed below, or by using the keyword search tool below to find specific information within the annual report.-
 1
1 -
 2
2 -
 3
3 -
 4
4 -
 5
5 -
 6
6 -
 7
7 -
 8
8 -
 9
9 -
 10
10 -
 11
11 -
 12
12 -
 13
13 -
 14
14 -
15
-
16
-
17
-
18
-
19
-
20
-
21
-
22
-
23
-
24
-
25
-
26
-
27
-
28
-
29
-
30
-
31
-
32
-
33
-
34
-
35
-
36
-
37
-
38
-
39
-
40
-
41
-
42
-
43
-
44
-
45
-
46
-
47
-
48
-
49
-
50
-
51
-
52
-
53
-
54
-
55
-
56
-
57
-
58
-
59
-
60
-
61
-
62
-
63
-
64
-
65
-
66
-
67
-
68
 |
 |

stakeholders
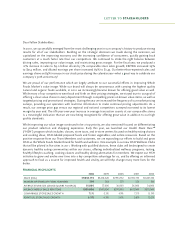
Dear Fellow Stakeholders:
In 2010, we successfully emerged from the most challenging year in our company’s history to produce strong
results for all of our stakeholders. Building on the strategic decisions we made during the recession, we
capitalized on the improving economy and the increasing confidence of consumers, quickly gaining back
customers at a much faster rate than our competitors. We continued to strike the right balance between
driving sales, improving our value image, and maintaining gross margin. For the fiscal year, we produced a
12% increase in sales to $9.0 billion driven by 7% comparable store sales growth; EBITDA increased 29%
to $714 million, and diluted earnings per share increased 69% to $1.43. Our better-than-expected sales and
earnings drove an 84% increase in our stock price during the calendar year--what a great way to celebrate our
company’s 30th anniversary!
We are proud of our performance which we largely attribute to our successful efforts in improving Whole
Foods Market’s value image. While our brand will always be synonymous with carrying the highest quality
natural and organic foods available, in 2010 we increasingly became known for offering good value as well.
While many of our competitors went back and forth on their pricing strategies, we stayed true to our goal of
offering a clear value choice in every department through compelling prices on known value items, as well as
targeted pricing and promotional strategies. During the year we increased the frequency of our market pricing
surveys, providing our operators with real-time information to make continual pricing adjustments. As a
result, our average price gap versus our regional and national competitors surveyed narrowed to its lowest
margin by year end. The 6% year-over-year increase in average transaction counts at our comparable stores
is a meaningful indication that we are now being recognized for offering great value in addition to our high
quality standards.
While improving our value image continued to be a top priority, we also remained focused on differentiating
our product selection and shopping experience. Early this year, we launched our Health Starts Here™
(“HSH”) program which includes: classes, store tours, and in-store centers focused on healthy eating choices
and cooking ideas; HSH-labeled prepared foods and frozen vegetables; and online resources. Based on the
positive response from our Team Members and customers, we are expanding our efforts to build and grow
HSH as the Whole Foods Market brand for health and wellness. One example is our new HSH Wellness Clubs
that will be piloted in five cities in 2011. Working with qualified doctors, these clubs will be designed to create
dynamic healthy eating communities within our stores, offering individualized wellness programs, testing,
healthy lifestyle coaching, cooking classes and healthy dining alternatives for members. We expect our HSH
initiative to grow and evolve over time into a key competitive advantage for us, and by offering an informed
approach to food as a source for improved health and vitality, we will help change many more lives for the
better.
FINANCIAL HIGHLIGHTS
2010 2009 2008 2007 2006
SALES (000s)$9,005,794 $8,031,620 $7,953,912 $6,591,773 $5,607,376
NUMBER OF STORES AT FISCAL YEAR END 299 284 275 276 186
AVERAGE STORE SIZE (GROSS SQUARE FOOTAGE) 38,000 37,000 36,000 34,000 34,000
AVERAGE WEEKLY SALES PER STORE $588,000 $549,000 $570,000 $617,000 $593,000
COMPARABLE STORE SALES GROWTH 7.1% -3.1% 4.9% 7.1% 11.0%
IDENTICAL STORE SALES GROWTH 6.5% -4.3% 3.6% 5.8% 10.3%
203719_NARR_R2.indd 1 1/11/11 2:46 PM