Whole Foods 2010 Annual Report Download - page 4
Download and view the complete annual report
Please find page 4 of the 2010 Whole Foods annual report below. You can navigate through the pages in the report by either clicking on the pages listed below, or by using the keyword search tool below to find specific information within the annual report.-
 1
1 -
 2
2 -
 3
3 -
 4
4 -
 5
5 -
 6
6 -
 7
7 -
 8
8 -
 9
9 -
 10
10 -
 11
11 -
 12
12 -
 13
13 -
 14
14 -
 15
15 -
16
-
17
-
18
-
19
-
20
-
21
-
22
-
23
-
24
-
25
-
26
-
27
-
28
-
29
-
30
-
31
-
32
-
33
-
34
-
35
-
36
-
37
-
38
-
39
-
40
-
41
-
42
-
43
-
44
-
45
-
46
-
47
-
48
-
49
-
50
-
51
-
52
-
53
-
54
-
55
-
56
-
57
-
58
-
59
-
60
-
61
-
62
-
63
-
64
-
65
-
66
-
67
-
68
 |
 |

stakeholders
In September, we became the first national grocer to partner with the Blue Ocean Institute and Monterey
Bay Aquarium and provide our customers with an easy-to-understand, science-based sustainability rating
system for wild-caught seafood. The system’s green, yellow and red ratings make it easy for shoppers to make
informed choices, with green or “best choice” ratings indicating a species is relatively abundant and is caught
in environmentally-friendly ways.
We always are looking for ways to raise the bar and further differentiate the Whole Foods Market shopping
experience. Our internal research shows we have a healthy combination of loyal core customers who have
continued to shop with us and new customers who are discovering us for the first time. We believe our
initiatives in areas such as value, healthy eating and seafood sustainability are aligned with our core customer
base, reinforce our position as the authentic retailer of natural and organic foods, and make us the preferred
choice for customers aspiring to a healthier lifestyle.
Our new stores are performing very well. This past year, we opened 16 stores and acquired two stores,
expanding into six new market areas. Our new store performance showed strong year-over-year improvement,
with this year’s class producing 190 basis points higher store contribution as a percentage of sales than last
year’s class. New stores this year were approximately 20% smaller in size, averaging 43,000 square feet, and
produced average weekly sales per store of $503,000, translating to 17% higher sales per square foot of $652.
Our improved capital disciplines, which include a leaner, more disciplined approach to design and building
and a shift to smaller stores with simpler décor and less labor-intensive perishable departments, helped
drive a 17% decrease in our average development cost per square foot and a 260 basis point year-over-year
improvement in return on invested capital to 8.9%.
We are pleased with how quickly we have been able to make adjustments regarding our new store development
pipeline. We were poised to open 25 to 30 new stores in 2009. Based on the recession and our desire to
preserve capital, however, we cut our store opening plans to 15 and then proceeded to trim approximately 1.4
million square feet from our development pipeline. Given the stabilization of the economy, our strong sales
momentum, healthy balance sheet, and the availability of favorable real estate opportunities, we think the
time is right to build our pipeline once again. We have the infrastructure and leadership in place to grow faster,
and our focus on opening smaller stores that reach profitability sooner should result in healthy returns over
the long run. With the announcement of 20 new leases signed in 2010, we are well positioned to step up our
growth beginning in 2012.
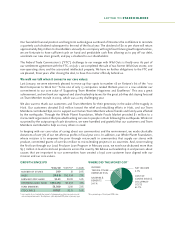
In 2010, we delivered incremental operating margin improvement and earnings growth in excess of sales
growth. We balanced our value investments by taking advantage of buying opportunities, and we improved our
distribution, shrink control and inventory management to produce higher gross margin throughout the year.
Our higher sales growth allowed us to better leverage certain fixed costs such as occupancy and depreciation.
With the new systems and tools we put in place to successfully manage through the recession, focusing on
expense control is now systemic in how we operate and thus much more consistent.
Our solid financial performance and capital expense discipline resulted in a steady generation of free cash
flow and a healthy balance sheet. For the fiscal year, we produced $585 million in cash flow from operations
and invested $257 million in capital expenditures, resulting in free cash flow of $328 million. We ended the year
with approximately $645 million in total cash, including cash equivalents, restricted cash, and investments,
with an additional $343 million available on our credit line. With our excess cash, we paid off $210 million of
our term loan in the third quarter and an additional $100 million subsequent to the end of the fourth quarter,
bringing our remaining term loan balance to $390 million.
203719_NARR_R2.indd 2 1/11/11 2:46 PM