Washington Post 2006 Annual Report Download - page 3
Download and view the complete annual report
Please find page 3 of the 2006 Washington Post annual report below. You can navigate through the pages in the report by either clicking on the pages listed below, or by using the keyword search tool below to find specific information within the annual report.-
 1
1 -
 2
2 -
 3
3 -
 4
4 -
 5
5 -
 6
6 -
 7
7 -
 8
8 -
 9
9 -
 10
10 -
 11
11 -
 12
12 -
 13
13 -
 14
14 -
15
-
16
-
17
-
18
-
19
-
20
-
21
-
22
-
23
-
24
-
25
-
26
-
27
-
28
-
29
-
30
-
31
-
32
-
33
-
34
-
35
-
36
-
37
-
38
-
39
-
40
-
41
-
42
-
43
-
44
-
45
-
46
-
47
-
48
-
49
-
50
-
51
-
52
-
53
-
54
-
55
-
56
-
57
-
58
-
59
-
60
-
61
-
62
-
63
-
64
-
65
-
66
-
67
-
68
-
69
-
70
-
71
-
72
-
73
-
74
-
75
-
76
-
77
-
78
-
79
-
80
-
81
-
82
-
83
-
84
-
85
-
86
-
87
-
88
-
89
-
90
-
91
-
92
-
93
-
94
-
95
-
96
 |
 |

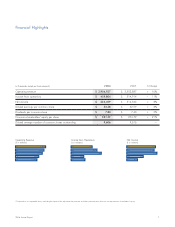
2006 Annual Report 1
(in thousands, except per share amounts) 2006 20 05 % Change
Operating revenue $ 3,904,927 $ 3,553,887 + 10%
Income from operations $ 459,804 $ 514,914 – 11%
Net income $ 324,459 $ 314,344 + 3%
Diluted earnings per common share $ 33.68 $ 32.59 + 3%
Dividends per common share $ 7.80 $ 7.40 + 5%
Common shareholders’ equity per share $ 331.32 $ 274.79 + 21%
Diluted average number of common shares outstanding 9,606 9,616
–
Financial Highlights
Operating Revenue
($ in millions)
Income from Operations
($ in millions)
Net Income
($ in millions)
*Computed on a comparable basis, excluding the impact of the adjustment for pensions and other postretirement plans on average common shareholders’ equity.
03 2,839
06
05
04
02 2,584
3,300
3,554
3,905
03 364
06
05
04
02 378
563
515
460
03 241
06
05
04
02 204
333
314
324