Wacom 2010 Annual Report Download - page 12
Download and view the complete annual report
Please find page 12 of the 2010 Wacom annual report below. You can navigate through the pages in the report by either clicking on the pages listed below, or by using the keyword search tool below to find specific information within the annual report.-
 1
1 -
 2
2 -
 3
3 -
 4
4 -
 5
5 -
 6
6 -
 7
7 -
 8
8 -
 9
9 -
 10
10 -
 11
11 -
 12
12 -
 13
13 -
 14
14 -
 15
15 -
 16
16 -
 17
17 -
 18
18 -
 19
19 -
 20
20 -
 21
21 -
 22
22 -
23
 |
 |

(For the year’s ended March 31)
(For the year’s ended March 31)
(For the year’s ended March 31)
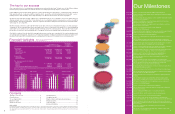
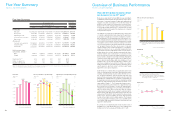
Overview of Business Performance
Wacom Co., Ltd. and Its Subsidiaries
Our results by business sector
’10 31,634
’09 33,058
(Millions of yen)
(Millions of yen)
Sales
Operating
income
ESD Business
DOWN 4.3%
DOWN 21.4%
4,880
’10
6,211
’09
2010
¥32,045
Sales Breakdown by Business
ECS Business 2.2%
411
’10
751
’09
(Millions of yen)
Sales
Operating
income
ECS Business
DOWN 45.3%
△109
’10
49
’09
ESD Business 97.8%
2009
¥33,809
ECS Business 1.3%
ESD Business 98.7%
21
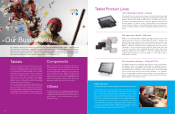
Electronic Systems and Devices (ESD)
business
Global sales of our tablet business maintained the same
level as the previous year in the harsh conditions such as
a decrease of corporate investment in plant and equip-
ment and a sluggish consumer consumption despite the
fact that the Company took the measure of developing
new products to drive up consumer demand. In the pro-
fessional segment, the sales of “Intuos4” released at the
end of the previous fiscal year and “Intuos4 Wireless”
released in February showed steady growth. On the con-
sumer tablet side, “Bamboo” series recovered from a
sales drop of the previous product in 1H and slightly
exceeded the sales level of the previous year owing to
“Bamboo” new series adding multi-touch function
launched in September. As for LCD tablets, the sales
decreased due to struggle of high-priced models such as
“Cintiq” series for professional graphics fields influenced
by the reduction of corporate investment in plant and
equipment, despite the favorable sales growth of “Sign-
Pad” for the security field in Europe.
With regard to the components business, the multi touch
sensor system for Windows 7 was mass-produced and
its shipment began in August. However, sales recorded a
remarkable decrease because the acknowledgment of
the touch function by ordinary users has not advanced
enough from initial assumptions and sales to major cus-
tomers of the components business were also sluggish.
As for a professional DJ device, “nextbeat” as a new
entry in the music device field, the new business faced
severe results, due to taking more time to change the
playing style of professional DJs and to develop a distri-
bution channel than was the initial assumption.
As a result, the ESD business sales ended at ¥31.63bn
(-4.3% YoY), and operating profit ¥4.88bn (-21.4% YoY).
Engineering Collaborative Solutions (ECS)
business
ECS business suffered from the severe business environ-
ment. Its sales remained at a lower level due to the
decrease of manufacturer’ s investment in plant and
equipment. In the above-mentioned situation, the ECS
business provided incentives for existing users to
upgrade, and for other CAD product users to replace their
existing software by launching the latest product, “ECAD
/ dio” Ver. 10.0, an electronic designing CAD solution in
September. The business also made efforts to promote
sales activities by refurbishing the website and participat-
ing in domestic exhibitions and focused on the acquisi-
tion and renewal of annual maintenance contracts.
As a result, ECS business sales ended at ¥410mn(-45.3%
YoY) and operating loss ¥109mn (OP ¥49mn in previous
fiscal year).
0
500
1,000
1,500
2,000
2,500
3,000
3,500
4,000
(Millions of yen)
(Millions of yen)
’06 ’07 ’08 ’09
’06 ’07 ’08
-1600
-1500
-1000
-400
-300
-200
-100
0
’09
’06 ’07 ’08 ’09 ’10
’10
(For the year’s ended March 31) (For the year’s ended March 31)
(For the year’s ended March 31)
(For the year’s ended March 31)
Cash f lows from operating activities
Cash f lows from investing activities
(Millions of yen)
-3,000
-2,000
-1,000
0
1,000
2,000
3,000
4,000
Cash f lows from f inancing activities
-2,676
-1,199
3,720
-1,229
-511
-1,174
’10
-805
-93
-323
-1,539
1,478
3,606
2,270
3,758
3,461
0
1,000
2,000
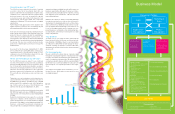
Cash Dividends per Share / Payout Raito
’06 ’08 ’09 ’10’07
Cash Dividends per share(yen)
Pay out Raito(%)
22
Our financial position
Total assets increased by ¥2.57bn to ¥28.20bn compared
with the end of the previous fiscal year. The main reasons
were a ¥0.80bn increase in notes and accounts receiv-
able and a ¥1.02bn increase in other current assets due
to the increase of materials supplied to manufacturers at
cost for launching new products, and a ¥0.76bn increase
in intangible fixed assets due to the acquisition of intel-
lectual property for maintaining the competitiveness and
the structuring of the next enterprise resource planning
systems.
Total liabilities increased by ¥2.10bn to ¥9.93bn com-
pared with the end of the previous fiscal year. The main
reasons for the increase were a ¥1.09bn in notes and
accounts payable mainly due to the increase in the pur-
chase of materials for the launching of new products and
a ¥399mn in accrued income tax.
Total net assets increased by ¥0.47bn to ¥18.27bn. The
main reason for the increase was a ¥1.97bn increase in
retained earnings, despite a ¥1.21bn payment of share-
holders’ dividends and a ¥0.29bn decrease in foreign cur-
rency translation adjustments due to the appreciation of
the Japanese yen.
Consolidated cash & cash equivalents increased by
¥1.34bn (+¥2.56bn YOY) to ¥12.35bn, compared with the
end of the previous fiscal year.
(Cash Flow from Operating Activities)
Earned operating cash flow for was ¥3.61bn (¥1.48bn
gained in the previous fiscal year). The main reasons for
the increase were a ¥3.12bn in the sum of NPBT, a ¥0.76n
in depreciation, and a ¥1.13bn increase in accounts pay-
able, despite a ¥1.49bn increase in account receivable.
(Cash Flow from Investing Activities)
Investing cash flow was ¥0.81bn. (¥1.17bn expended in
the previous fiscal year) The main reasons were the pur-
chases of mold, intellectual property, and the next enter-
prise resource planning systems of ¥1.31bn in fixed
assets and a proceed from redemption of held-to-
maturity securities of ¥0.5bn.
(Cash Flow from Financing Activities)
Financing cash flow for was ¥1.20bn. (¥2.68bn expended
in the previous fiscal year) The main reason was a pay-
ment of shareholders’ dividends of ¥1.20bn.
18.4
1,000
21.8
1,500
29.9
48.3
2,500
3,000
61.2
3,000
60
50
40
30
20
10
3,000