Wacom 2010 Annual Report Download - page 11
Download and view the complete annual report
Please find page 11 of the 2010 Wacom annual report below. You can navigate through the pages in the report by either clicking on the pages listed below, or by using the keyword search tool below to find specific information within the annual report.-
 1
1 -
 2
2 -
 3
3 -
 4
4 -
 5
5 -
 6
6 -
 7
7 -
 8
8 -
 9
9 -
 10
10 -
 11
11 -
 12
12 -
 13
13 -
 14
14 -
 15
15 -
 16
16 -
 17
17 -
 18
18 -
 19
19 -
 20
20 -
 21
21 -
 22
22 -
23
 |
 |

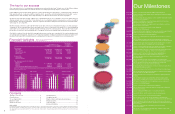
4,311
16,761
15,668
’06 ’07 ’08 ’09
(Millions of yen)
0
5,000
10,000
15,000
20,000
25,000
35,000
40,000
30,000
’10 ’06 ’07 ’08 ’09 ’10 ’06 ’07 ’08 ’09
(Millions of yen) (%) (Millions of yen) (%)
0
5,000
10,000
15,000
20,000
35
40
45
50
55
0
1,000
2,000
3,000
4,000
6,000
5,000
0
5
10
15
20
30
25
’10
(For the year’s ended March 31) (For the year’s ended March 31) (For the year’s ended March 31)
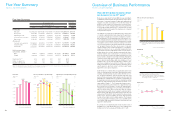
Five-Year Summary
Net sales
Operating income/Operating margin
Gross profit/Gross profit margin
For the year:
Net sales
Gross profit
Operating income
Income before income taxes
Net income
At year end:
Cash and cash equivalents
Total net assets
Total assets
Net income per share
(yen and U.S. dollars):**
Basic
Diluted
Equity ratio(%)***
Return on equity (%)
Number of employees
¥23,992,206
11,970,76 2
3,424,365
3,400,678
2,145,821
10,342,643
13,287,904
21,032,863
5,420.51
5,283.96
63.2
21.5
465
¥33,809,138
16,761,164
4,311,378
4,179,661
2,579,025
11,014,114
17,796,487
25,631,057
¥36,739,196
18,640,355
5,538,871
5,564,082
3,501,360
13,577,194
18,516,742
29,221,330
8,348.74
8,304.38
63.5
20.1
584
$344,417
168,402
33,618
33,544
21,157
132,740
196,363
303,089
¥28,787,066
15,027,641
4,564,593
4,738,219
2,853,274
12,707,153
16,320,081
25,152,191
6,886.19
6,784.24
64.9
19.3
511
Thousands of yen Thousands of
U.S. dollars*
Year ended March 31 Year ended
March 31
Five-Year Summary
Wacom Co., Ltd. and Its Subsidiaries
23,992
28,787
36,739
33,80932,045
11,971
15,028
18,640
49.9
50.7
52.2
3,424
4,565
14.3
15.9
5,539
15.1
12.8
9.8
3,128
19
49.6
48.9
¥6,213.93
¥6,197.78
69.4
14.2
637
$52.66
$52.54
*Note 1: U.S. dollar amounts have been translated from yen, for convenience only, at the rate of ¥93.04=U.S.$1, the approximate exchange rate prevailing on March 31, 2010.
**Note 2: 20,000 shares were repurchesed as treasury stock for 1.85BJPY in 2009.3 F.Y..
2006 2009 2010
¥32,044,578
15,668,147
3,127,822
3,120,867
1,968,406
12,350,113
18,269,590
28,199,429
¥4,899.57
¥4,888.56
64.8
10.9
702
201020082007
0
2,000
4,000
6,000
8,000
10,000
0
5
10
15
20
25
30
40
50
60
70
80
(Millions of yen)
(%)
(%)
’06 ’07 ’08 ’09 ’10
’06 ’07 ’08 ’09 ’10
’06 ’07 ’08 ’09 ’10
(For the year’s ended March 31)
(For the year’s ended March 31)
(For the year’s ended March 31)
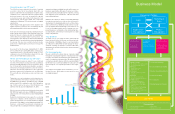
Overview of Business Performance
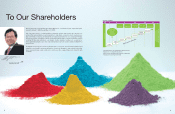
How did the global economy affect
our business in our 27th year?
(ROE)
(ROA)
Note: Common shares were split on a four-for-one basis on November
18,2005. Per share data before 2005.3.F.Y.term reflect the above
share splits.
Wacom Co., Ltd. and Its Subsidiaries
Net income per share (basic)
ROE/ROA
Equity ratio
5,421
6,886
8,349
6,214
4,900
21.5
19.3
20.1
12.2 12.4 12.9
14.2
10.9
7.3
9.4
63.2 64.9 63.5
69.4
64.8
Note 1: ROA equals net income/average total assets.
Note 2: During its 23rd fiscal year, the Group procured through a
public offering approximately 4.2 billion yen in capital funds
by allocating new shares to a third party.
20
Our business environment for fiscal 2009, the year ended March
31, 2010 has remained severe throughout the fiscal year, due to
a decrease of corporate investment in plant and equipment and
sluggish consumer consumption. Yet on the other hand, the
global economic situation is showing signs of mild recovery,
thanks to the economic stimulus measures by each government.
In the foreign exchange market, the U.S. dollar and Euro showed
a significant depreciation against the Japanese yen compared
to the previous fiscal year.
The Japanese economy has not attained the full-scale recovery
of corporate capital investment and employment though domes-
tic production activities and consumer consumption of automo-
biles and flat panel TVs showed gradual recovery owing to eco-
nomic stimulus measures and export expansion to Asian coun-
tries. In the US., the financial crisis was averted and consumer
consumption went out of the worst period owing to the exten-
sion of home buyer tax credit and the federal “Cash for Clunk-
ers” program. However, the full-scale recovery of corporate
capital investment and consumer assumption is considered to
require more time due to an on-going high unemployment rate
and continuous inventory adjustment. The EU economy shows a
pickup owing to the economic stimulus measures by each gov-
ernment. However, each country wasn’ t on a track to recovery
due to the decrease in corporate capital investment, the slug-
gish consumer consumption caused by worsening employment
conditions, and the deep-seated credit crunch for financial insti-
tutions demonstrated by Dubai debt crisis and Greece's fiscal
problems. The economy in the Asia-Oceania countries in gen-
eral shows a steady recovery trend. The Chinese economy is
making a favorable recovery led by domestic demand as well as
export expansion, which also gives South Korea and Taiwan
ripple effects of production expansion.
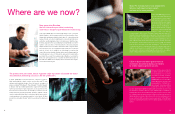
Under the above conditions, Wacom aggressively devoted its
efforts to developing new technologies, and developing, manu-
facturing, and selling new products as well as efficient cost con-
trol. The professional tablet, “Intuos4” released at the end of the
previous fiscal year enjoyed a high reputation and the latest 3D
filmmaking also expanded the use of tablets. In September, the
Company announced a new user interface strategy by adding
multi-touch, and at the same time, released a new series of con-
sumer tablets, “Bamboo” . The Company also began to mass-
produce and provide a new multi-touch component that sup-
ports the functions of Windows 7 to major PC manufacturers,
strengthening its leadership in the user interface field. Addition-
ally in the music device field as a new entry, Wacom commer-
cialized a professional DJ device “nextbeat” and promoted it in
Europe mainly. LCD tablets strengthened the product line and
released new "Cintiq21UX" which adopted the advanced pen
technology of "Intuos4" in March as well as wide-size LCD
models and a portable model for digital signature. The Company
set up to promote the IT infrastructure such as an ERP system
and a global SCM system which increases its productivity and
supports its future growth.
As a result, the consolidated business results ended in sales of
¥32.04bn (-5.2% YoY), OP ¥3.13bn (-27.5% YoY),ordinary profit
¥3.16bn (-24.5% YoY), and net profit ¥1.97bn (-23.7% YoY).