Wacom 2007 Annual Report Download - page 17
Download and view the complete annual report
Please find page 17 of the 2007 Wacom annual report below. You can navigate through the pages in the report by either clicking on the pages listed below, or by using the keyword search tool below to find specific information within the annual report.-
 1
1 -
2
-
3
-
4
-
5
-
6
-
 7
7 -
 8
8 -
 9
9 -
 10
10 -
 11
11 -
 12
12 -
 13
13 -
 14
14 -
 15
15 -
 16
16 -
 17
17 -
 18
18 -
 19
19 -
 20
20 -
 21
21 -
 22
22 -
 23
23 -
 24
24 -
 25
25 -
 26
26 -
 27
27 -
28
-
29
-
30
-
31
-
32
-
33
-
34
-
35
-
36
 |
 |

0
5,000
10,000
15,000
20,000
25,000
30,000
0
5
10
15
20
25
30
40
50
60
70
80
(Millions of yen)
(%)
(%)
’03 ’04 ’05 ’06 ’07
’03 ’04 ’05 ’06 ’07
’03 ’04 ’05 ’06 ’07
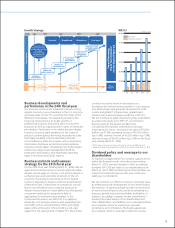
Overview of Business Performance
Market Environment and
Business Results
The business environment for Wacom group companies
in the scal year under review (from April 1, 2006 to
March 31, 2007) was generally favorable, in spite of high
oil prices and fear of a slowdown in growth of the U.S.
economy. Japanese business investment was made
possible due to economic recovery; however, the rate
of PC-related market growth was negative due to the
increased demand for large-size LCD TVs, the
postponement of the Windows Vista release, and the
resulting trend by consumers to hold o purchasing
new PCs. In the United States, IT-related investment
growth rate slowed, but consumer spending was not as
bad as previously feared. In the EU, domestic
demand-propelled economic expansion continued in
both plant investment and consumer spending. East EU
market expansion continued as well. The Chinese
economy continued to grow at a fast pace and its
market expansion continued. In Asian areas other than
China and Japan, the market environment remained
positive.
Under these circumstances, Wacom was able to
maintain sales growth due to market penetration and
continuous expansion of professional product users,
expansion of sales channels for consumer products, and
rapid growth in sales of interactive pen displays. Wacom
was also involved in new user-interface technology
development, new product development related to
Windows Vista, business expansion in Asia-Pacic,
preparation for a global branding initiative, J-SOX Act
compliance, application for APA, and integration of
environmental and quality management. Wacom
initiated proactive IR with foreign investors, visiting the
EU and Asia beginning this scal year, and received the
rst “Disclosure Newcomer Award” by the TSE in
recognition of the high quality of its IR activities.
As a result, net sales ended at ¥28,787 million, or U.S.
$244 million (up 20.0% year-over-year); operating
income ¥4,565 million, or U.S. $39 million (up 33.3%
year-over-year); and net income ¥2,853 million, or U.S.
$24 million (up 33.0% year-over-year).
(ROE)
(ROA)
Note: Common shares were split on a ve-for-one basis on November
20, 2003 and on a four-for-one basis on November 18, 2005.
Wacom Co., Ltd. and Its Subsidiaries
Net income per share (basic)
ROE/ROA
Equity ratio
28,089
6,154
9,826
5,421
6,886
10.6 11.1
15.2
21.5
19.3
4.3 4.7
7.0
12.2 12.4
39.8
43.9
47.5
63.2 64.9
Note 1: ROA equals net income/average total assets.
Note 2: During its 23rd scal year, the Group procured through a public
oering approximately 4.2 billion yen in capital funds by
allocating new shares to a third party.
16