Visa 2014 Annual Report Download - page 4
Download and view the complete annual report
Please find page 4 of the 2014 Visa annual report below. You can navigate through the pages in the report by either clicking on the pages listed below, or by using the keyword search tool below to find specific information within the annual report.-
 1
1 -
 2
2 -
 3
3 -
 4
4 -
 5
5 -
 6
6 -
 7
7 -
 8
8 -
 9
9 -
 10
10 -
 11
11 -
 12
12 -
 13
13 -
 14
14 -
 15
15 -
16
-
17
-
18
-
19
-
20
-
21
-
22
-
23
-
24
-
25
-
26
-
27
-
28
-
29
-
30
-
31
-
32
-
33
-
34
-
35
-
36
-
37
-
38
-
39
-
40
-
41
-
42
-
43
-
44
-
45
-
46
-
47
-
48
-
49
-
50
-
51
-
52
-
53
-
54
-
55
-
56
-
57
-
58
-
59
-
60
-
61
-
62
-
63
-
64
-
65
-
66
-
67
-
68
-
69
-
70
-
71
-
72
-
73
-
74
-
75
-
76
-
77
-
78
-
79
-
80
-
81
-
82
-
83
-
84
-
85
-
86
-
87
-
88
-
89
-
90
-
91
-
92
-
93
-
94
-
95
-
96
-
97
-
98
-
99
-
100
-
101
-
102
-
103
-
104
-
105
-
106
-
107
-
108
-
109
-
110
-
111
-
112
-
113
-
114
-
115
-
116
-
117
-
118
-
119
-
120
-
121
-
122
-
123
-
124
-
125
-
126
-
127
-
128
-
129
-
130
-
131
-
132
-
133
-
134
-
135
-
136
-
137
-
138
-
139
-
140
-
141
-
142
-
143
-
144
-
145
-
146
-
147
-
148
-
149
-
150
-
151
-
152
-
153
-
154
-
155
-
156
-
157
-
158
-
159
-
160
-
161
 |
 |

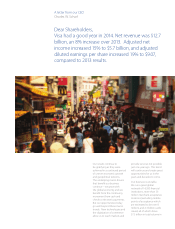
Dear Shareholders,
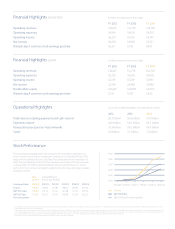
Visa had a good year in 2014. Net revenue was $12.7
billion, an 8% increase over 2013. Adjusted net
income increased 15% to $5.7 billion, and adjusted
diluted earnings per share increased 19% to $9.07,
compared to 2013 results.
A letter from our CEO
Charles W. Scharf
Our results continue to
be gratifying as they were
achieved in a continued period
of uneven economic growth
and geopolitical tensions.
The underlying macro drivers
that benefit our business
continue – we grow with
the global economy and we
benefit from the continuing
movement from cash and
check to electronic payments.
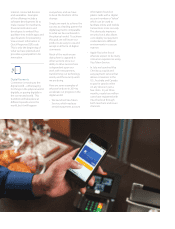
But our opportunities today
go well beyond these macro
trends. New technologies and
the digitization of commerce
allow us to reach markets and
provide services not possible
just one year ago. This trend
will continue and create great
opportunities for us in the
years and decades to come.
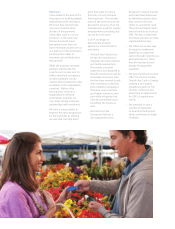
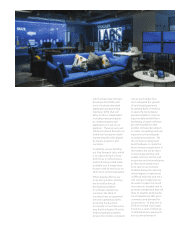
Our business is enviable.
We run a great global
network of 14,300 financial
institutions, more than 36
million merchant acceptance
locations (excluding mobile
points of acceptance which
are estimated to be over 8
million), and 2.3 billion cards
issued, all of which drove
$7.3 trillion in total volume in