Ubisoft 2012 Annual Report Download - page 11
Download and view the complete annual report
Please find page 11 of the 2012 Ubisoft annual report below. You can navigate through the pages in the report by either clicking on the pages listed below, or by using the keyword search tool below to find specific information within the annual report.-
 1
1 -
 2
2 -
 3
3 -
 4
4 -
 5
5 -
 6
6 -
 7
7 -
 8
8 -
 9
9 -
 10
10 -
 11
11 -
 12
12 -
 13
13 -
 14
14 -
 15
15 -
 16
16 -
 17
17 -
 18
18 -
 19
19 -
 20
20 -
 21
21 -
 22
22 -
23
-
24
-
25
-
26
-
27
-
28
-
29
-
30
-
31
-
32
-
33
-
34
-
35
-
36
-
37
-
38
-
39
-
40
-
41
-
42
-
43
-
44
-
45
-
46
-
47
-
48
-
49
-
50
-
51
-
52
-
53
-
54
-
55
-
56
-
57
-
58
-
59
-
60
-
61
-
62
-
63
-
64
-
65
-
66
-
67
-
68
-
69
-
70
-
71
-
72
-
73
-
74
-
75
-
76
-
77
-
78
-
79
-
80
-
81
-
82
-
83
-
84
-
85
-
86
-
87
-
88
-
89
-
90
-
91
-
92
-
93
-
94
-
95
-
96
-
97
-
98
-
99
-
100
-
101
-
102
-
103
-
104
-
105
-
106
-
107
-
108
-
109
-
110
-
111
-
112
-
113
-
114
-
115
-
116
-
117
-
118
-
119
-
120
-
121
-
122
-
123
-
124
-
125
-
126
-
127
-
128
-
129
-
130
-
131
-
132
-
133
-
134
-
135
-
136
-
137
-
138
-
139
-
140
-
141
-
142
-
143
-
144
-
145
-
146
-
147
-
148
-
149
-
150
-
151
-
152
-
153
-
154
-
155
-
156
-
157
-
158
-
159
-
160
-
161
-
162
-
163
-
164
-
165
-
166
-
167
-
168
-
169
-
170
-
171
-
172
-
173
-
174
-
175
-
176
-
177
-
178
-
179
-
180
-
181
-
182
-
183
-
184
-
185
-
186
-
187
-
188
-
189
-
190
-
191
-
192
 |
 |

Management Report
2012
6
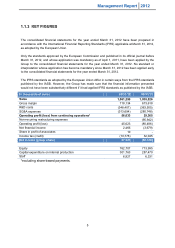
Cash flow statement for comparison with other industry players (unaudited and not part of the
consolidated accounts)
In thousands of euros
03/31/12
03/31/11
adjusted*
03/31/11
published
Consolidated earnings
37,321
(52,120)
(52,120)
+/- Share in profit of associates
(10)
-
-
+/- Gaming software amortization
270,530
382,906
382,906
+/- Other amortization
19,596
22,377
22,377
+/- Provisions
(7,296)
6,684
6,684
+/- Cost of share-based payments
10,410
12,556
12,556
+/- Gains/losses on disposals
(8,412)
(5,559)
356
+/- Other income and expenses calculated
731
271
271
+/- Internal development and license development costs
(349,859)
(338,820)
(338,820)
Cash flows from operating activities
(26,989)
28,295
34,210
Inventory
25,392
4,862
4,862
Trade receivables
64,914
19,389
19,389
Other assets
(34,699)
(932)
3,635
Trade payables
(16,663)
(4,559)
(4,559)
Other liabilities
(3,797)
7,110
7,110
+/- Change in WCR linked to operating activities
35,147
25,870
30,437
TOTAL CASH FLOW GENERATED BY OPERATING
ACTIVITIES
8,158
54,165
64,647
Cash flows from investing activities
- Payments for the acquisition of property, plant and
equipment and other intangible assets
(26,204)
(22,246)
(22,246)
+ Proceeds from the disposal of intangible assets and
property, plant and equipment
748
231
231
+ Proceeds from the disposal of Gameloft shares*
13,701
10,482
-
- Payments for the acquisition of financial assets
(6,298)
(16,095)
(16,095)
+ Repayment of loans and other financial assets
7,584
17,003
17,003
+/- Changes in consolidation scope(1)
(17,970)
(5,465)
(5,465)
CASH USED FROM INVESTING ACTIVITIES
(28,440)
(16,090)
(26,573)
Cash flows from financing activities
+ New finance leases contracted
47
36
36
- Repayment of finance leases
(201)
(192)
(192)
+ New borrowings
-
86
86
- Repayment of borrowings
(21,791)
(750)
(750)
+ Funds received from shareholders in capital increases
446
1,771
1,771
+/- Sales/purchases of own shares
(1,717)
(422)
(422)
+/- Other cash flows (disposal of tax credit resulting from
loss carryback)
-
21,886
21,886
CASH GENERATED (USED) BY FINANCING
ACTIVITIES
(23,216)
22,415
22,415
Net change in cash and cash equivalents
(43,498)
60,490
60,490
Cash and cash equivalents at the beginning of the period
122,034
64,976
64,976
Impact of translation adjustments
7,789
(3,433)
(3,433)
Cash and cash equivalents at the end of the period
86,326
122,034
122,034
(1) including cash in companies acquired and disposed of
7,211
141
141
*Change in the presentation of the disposal of Gameloft shares under investing activities.