US Bank 2013 Annual Report Download - page 6
Download and view the complete annual report
Please find page 6 of the 2013 US Bank annual report below. You can navigate through the pages in the report by either clicking on the pages listed below, or by using the keyword search tool below to find specific information within the annual report.-
 1
1 -
 2
2 -
 3
3 -
 4
4 -
 5
5 -
 6
6 -
 7
7 -
 8
8 -
 9
9 -
 10
10 -
 11
11 -
 12
12 -
 13
13 -
 14
14 -
 15
15 -
 16
16 -
 17
17 -
18
-
19
-
20
-
21
-
22
-
23
-
24
-
25
-
26
-
27
-
28
-
29
-
30
-
31
-
32
-
33
-
34
-
35
-
36
-
37
-
38
-
39
-
40
-
41
-
42
-
43
-
44
-
45
-
46
-
47
-
48
-
49
-
50
-
51
-
52
-
53
-
54
-
55
-
56
-
57
-
58
-
59
-
60
-
61
-
62
-
63
-
64
-
65
-
66
-
67
-
68
-
69
-
70
-
71
-
72
-
73
-
74
-
75
-
76
-
77
-
78
-
79
-
80
-
81
-
82
-
83
-
84
-
85
-
86
-
87
-
88
-
89
-
90
-
91
-
92
-
93
-
94
-
95
-
96
-
97
-
98
-
99
-
100
-
101
-
102
-
103
-
104
-
105
-
106
-
107
-
108
-
109
-
110
-
111
-
112
-
113
-
114
-
115
-
116
-
117
-
118
-
119
-
120
-
121
-
122
-
123
-
124
-
125
-
126
-
127
-
128
-
129
-
130
-
131
-
132
-
133
-
134
-
135
-
136
-
137
-
138
-
139
-
140
-
141
-
142
-
143
-
144
-
145
-
146
-
147
-
148
-
149
-
150
-
151
-
152
-
153
-
154
-
155
-
156
-
157
-
158
-
159
-
160
-
161
-
162
-
163
 |
 |

4 U.S. BANCORP
Fellow Shareholders:
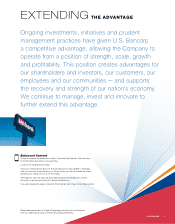
U.S. Bancorp remains true to its core strengths — serving
our customers and supporting our communities, engaging
our employees and helping our country. We reward our
shareholders by ensuring that the Company remains strong,
prudently managed and profitable.
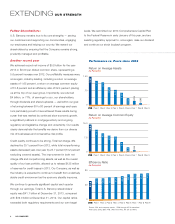
Another record year
We achieved record net income of $5.8 billion for the year
2013 or $3.00 per diluted common share, representing a
5.6 percent increase over 2012. Our profitability measures were,
once again, industry-leading, including a return on average
assets of 1.65 percent, a return on average common equity
of 15.8 percent and an efficiency ratio of 52.4 percent, placing
us at the top of our peer group. Importantly, we returned
$4 billion, or 71%, of earnings to you, our shareholders,
through dividends and share buybacks — well within our goal
of returning between 60 to 80 percent of earnings each year.
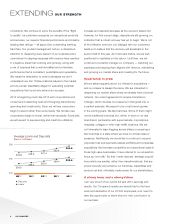
I am particularly proud to have achieved these results during
a year that was marked by continued slow economic growth,
a significant pullback in mortgage activity and ongoing
regulatory and legislative change and uncertainty. Our results
clearly demonstrate the benefits we derive from our diverse
mix of businesses and conservative risk profile.
Credit quality continues to be strong. Total net charge-offs
declined by 30.1 percent from 2012, while total nonperforming
assets decreased year-over-year by 23.7 percent (13.2 percent
excluding covered assets). The improvement in both net
charge-offs and nonperforming assets, as well as the overall
quality of our loan portfolio, allowed us to release $125 million
of reserves for credit losses in 2013. Our Company, as well as
the industry, is expected to continue to benefit from a relatively
stable credit environment as the economy steadily improves.
We continue to generate significant capital each quarter
through our earnings. Total U.S. Bancorp shareholders’
equity was $41.1 billion at December 31, 2013, compared
with $39.0 billion at December 31, 2012. Our capital ratios
exceeded both regulatory requirements and our own target
levels. We submitted our 2014 Comprehensive Capital Plan
to the Federal Reserve in early January of this year, and are
awaiting regulatory approval to, once again, raise our dividend
and continue our stock buyback program.
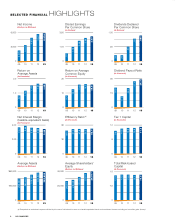
Source: SNL and company reports, 1Q08 through 4Q13 annualized
Peer banks: BAC, BBT, FITB, JPM, KEY, PNC, RF, STI and WFC
Return on Average Assets
(In Percents)
1.40
.70
0
USB Peer 1 Peer 2 Peer 3 Peer 9
1.37
1.17
1.10
0.85
Peer 4
0.73
Peer 5
0.59
Peer 6
0.32
Peer 7
0.19
Peer 8
0.08
Return on Average Common Equity
(In Percents)
15.0
7.5
0
USB Peer 1 Peer 2 Peer 3 Peer 9
14.2
11.5
9.6
8.4
Peer 4
7.9
Peer 5
4.8
Peer 6
2.3
Peer 7
0.8
Peer 8
Efficiency Ratio
(In Percents)
80
40
0
USB Peer 1 Peer 2 Peer 3 Peer 9
50.6
57.5
57.6
60.2
Peer 4
61.2
Peer 5
63.9
68.7
70.6
70.8
71.9
Peer 6 Peer 7 Peer 8
Performance vs. Peers since 2008
EXTENDING OUR STRENGTH