US Bank 2011 Annual Report Download - page 6
Download and view the complete annual report
Please find page 6 of the 2011 US Bank annual report below. You can navigate through the pages in the report by either clicking on the pages listed below, or by using the keyword search tool below to find specific information within the annual report.-
 1
1 -
 2
2 -
 3
3 -
 4
4 -
 5
5 -
 6
6 -
 7
7 -
 8
8 -
 9
9 -
 10
10 -
 11
11 -
 12
12 -
 13
13 -
 14
14 -
 15
15 -
 16
16 -
 17
17 -
18
-
19
-
20
-
21
-
22
-
23
-
24
-
25
-
26
-
27
-
28
-
29
-
30
-
31
-
32
-
33
-
34
-
35
-
36
-
37
-
38
-
39
-
40
-
41
-
42
-
43
-
44
-
45
-
46
-
47
-
48
-
49
-
50
-
51
-
52
-
53
-
54
-
55
-
56
-
57
-
58
-
59
-
60
-
61
-
62
-
63
-
64
-
65
-
66
-
67
-
68
-
69
-
70
-
71
-
72
-
73
-
74
-
75
-
76
-
77
-
78
-
79
-
80
-
81
-
82
-
83
-
84
-
85
-
86
-
87
-
88
-
89
-
90
-
91
-
92
-
93
-
94
-
95
-
96
-
97
-
98
-
99
-
100
-
101
-
102
-
103
-
104
-
105
-
106
-
107
-
108
-
109
-
110
-
111
-
112
-
113
-
114
-
115
-
116
-
117
-
118
-
119
-
120
-
121
-
122
-
123
-
124
-
125
-
126
-
127
-
128
-
129
-
130
-
131
-
132
-
133
-
134
-
135
-
136
-
137
-
138
-
139
-
140
-
141
-
142
-
143
-
144
-
145
-
146
-
147
-
148
-
149
 |
 |

4 U.S. BANCORP
Momentum
continues
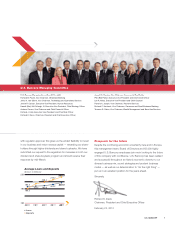
Fellow Shareholders:
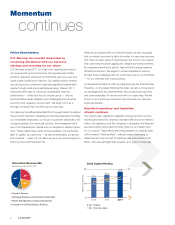
U.S. Bancorp has created momentum by
remaining disciplined with our business
strategy and investing for our future
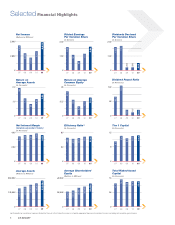
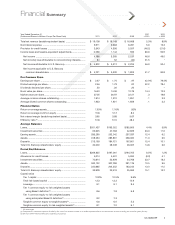
U.S. Bancorp ended 2011 on a high note, reporting both record
net revenue and record net income. We experienced notable
growth in deposits, loans and commitments year-over-year, and
credit quality continued to improve. Our capital position remains
very strong as we continued to generate signifi cant capital each
quarter through solid and predictable earnings. Indeed, 2011
marked another year of robust and sustainable fi nancial
performance — at the very top of our peer group — and we
achieved these results despite a very challenging and uncertain
economic and regulatory environment. We begin 2012 as a
stronger company than we were just one year ago.
U.S. Bancorp has differentiated itself from the peer banks throughout
the economic downturn, validating our franchise strengths, including
our remarkable employees, our focus on customer satisfaction, the
company policies of prudent risk controls, the management and
use of our shareholders’ capital and our disciplined, effi cient opera-
tions. These results have made us the benefi ciary of a continuing
fl ight to quality, as customers — as well as employees, prospects
and investors — seek out U.S. Bancorp as a very solid company in
which to place their fi nancial trust.
While we are pleased with our fi nancial results, we also recognize
that our nation’s economy is still in the midst of a very slow recovery.
Yes, there are clear areas of improvement, but some of our regions
and customers are still struggling and, despite some improvement,
the unemployment level is still too high and the housing market is
still without direction. We expect to remain steadfast in working
through these challenges with our customers and our communities
— for our collective and future success.
Contextual information is often as enlightening as the fi nancial data.
Therefore, on the pages following this letter, we tell you more about
our strategies and accomplishments, new products and services
and some examples of how we work with our customers. We will
focus on our continuing momentum and showcase our talented
employee leaders.
Unsettled regulatory and legislative
climate continues
The myriad rules, regulations, legislation and government scrutiny
following the economic downturn represent efforts by the Adminis-
tration, the regulators and the Congress to strengthen the fi nancial
services industry and prevent another crisis for our industry and
for our country. These efforts are being repeated on a global scale
which create a “trebling effect”, making it more challenging to
determine the “new normal” for banking rules and policies in the
future. This new paradigm also requires us to spend increasingly
32
16
0
12
6
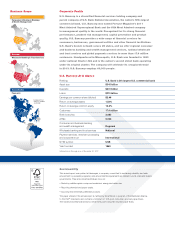
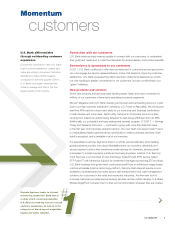
Solid Capital Position
2009 2010 2011
• Tier 1 Capital
• Tier 1 Common Ratio
22.6
(Dollars in Billions)
(In Percents)
25.9
29.2
8.6%
6.8%
7.8%
28%
20%
9%
43
%
• Payment Services
• Wholesale Banking and Commercial Real Estate
• Wealth Management and Securities Services
• Consumer and Small Business Banking
Diversified Revenue Mix
By business line 2011 YTD
28%
20%
8%
44%