Toshiba 2004 Annual Report Download - page 4
Download and view the complete annual report
Please find page 4 of the 2004 Toshiba annual report below. You can navigate through the pages in the report by either clicking on the pages listed below, or by using the keyword search tool below to find specific information within the annual report.-
 1
1 -
 2
2 -
 3
3 -
 4
4 -
 5
5 -
 6
6 -
 7
7 -
 8
8 -
 9
9 -
 10
10 -
 11
11 -
 12
12 -
 13
13 -
 14
14 -
 15
15 -
16
-
17
-
18
-
19
-
20
-
21
-
22
-
23
-
24
-
25
-
26
-
27
-
28
-
29
-
30
-
31
-
32
-
33
-
34
-
35
-
36
-
37
-
38
-
39
-
40
-
41
-
42
-
43
-
44
-
45
-
46
-
47
-
48
-
49
-
50
-
51
-
52
-
53
-
54
-
55
-
56
-
57
-
58
-
59
-
60
-
61
-
62
-
63
-
64
-
65
-
66
-
67
-
68
-
69
-
70
-
71
-
72
-
73
-
74
-
75
-
76
 |
 |

2
1,00
0
2,00
0
3
,00
0
4
,
00
0
5,000
6
,
000
10
2
0
30
5,
5
80
5,6
5
6
5,
74
9
5,39
4
5,95
1
2
0
0
0
0
0
0
0
0
0
0
0
0
0
0
0
0
0
0
0
0
0
0
0
0
0
0
0
0
0
0
0
0
0
0
0
0
0
0
0
0
0
0
0
0
0
0
0
0
0
0
0
0
0
0
0
0
0
0
0
0
0
0
0
0
0
0
0
0
0
0
0
0
0
0
0
0
0
0
0
0
0
0
0
0
0
0
0
0
0
0
0
0
0
0
0
0
0
0
2
7.
0
7
7
7
7
7
7
7
7
7
7
7
7
7
7
7
7
7
7
7
7
7
7
7
7
7
7
7
7
7
7
7
7
7
7
7
7
7
7
7
7
7
7
7
7
7
7
7
7
7
7
7
7
7
7
7
7
7
7
7
7
7
7
7
7
7
7
7
7
7
7
2
7
7
26
.
7
2
0
0
0
0
0
0
0
0
0
0
0
0
0
0
0
0
0
0
0
0
0
0
0
0
0
0
0
0
0
0
0
0
0
0
0
0
0
0
0
0
0
0
0
0
0
0
0
0
0
0
0
0
0
0
0
0
0
0
0
0
0
0
0
0
0
0
0
0
0
0
0
0
0
0
0
0
0
26
.
0
2
5
5
5
5
5
5
5
5
5
5
5
5
5
5
5
5
5
5
5
5
5
5
5
5
5
5
5
5
5
5
5
5
5
5
5
5
5
5
5
5
5
5
5
5
5
5
5
5
5
5
5
5
5
5
5
5
5
5
5
5
5
5
5
5
5
5
5
2
2
4.
5
2
4
4
4
4
4
4
4
4
4
4
4
4
4
4
4
4
4
4
4
4
4
4
4
4
4
4
4
4
4
4
4
4
4
4
4
4
4
4
4
4
4
4
4
4
4
4
4
4
4
4
4
4
4
4
4
4
4
4
4
4
4
4
4
4
4
4
4
4
4
4
4
4
4
4
4
4
4
4
4
4
4
4
4
2
7.
4
300
600
900
1
,
200
1,
5
00
1,3
7
9
1,
39
4
1,394
1
,4
3
7
1,396
-200
-
10
0
0
28
.
8
18
.5
-
32
.
9
-2
5
4.
0
96
.
2
100
-20
-
3
0
-
1
0
0
10
-
2
9
.
0
4
.
3
2
.
9
-
3
.
0
9
.1
-
30
0
02/300/3 01/3 03/3 04/3 02/300/3 01/3 03/3 04/3 02/300/3 01/3 03/3 04/3 02/300/3 01/3 03/3 04/3
Toshiba Corporation and its subsidiaries
For the years ended March 31, 2004 and 2003
FINANCIAL HIGHLIGHTS
Millions of yen Change (%)
Thousands of U.S. dollars
2004 2003 2004/2003 2004
Net sales–Japan ¥3,399,903 ¥3,343,551 1.7 $32,074,557
–Overseas 2,179,603 2,312,227 (5.7) 20,562,292
Net sales 5,579,506 5,655,778 (1.3) 52,636,849
Operating income 174,586 115,542 51.1 1,647,038
Income before income taxes
and minority interest 145,041 53,123 173.0 1,368,311
Net income 28,825 18,503 55.8 271,934
Total assets 4,462,200 5,238,936 (14.8) 42,096,226
Shareholders’ equity 754,990 571,064 32.2 7,122,547
Capital expenditures (property,
plant and equipment) 227,273 230,512 (13.6) 1,878,557
Research and development expenditures 336,714 331,494 1.6 3,176,547
Return on equity (ROE) (%) 4.3 2.9 —
Return on total assets (ROA) (%) 0.6 0.3 —
Yen U.S. dollars
Per share of common stock:
Net income
–basic ¥8.96 ¥5.75 55.8 $0.085
–diluted 8.96 5.75 55.8 0.085
Cash dividends 3.00 3.00 — 0.028
Number of employees 161,000 166,000 (3.0)
Notes: 1. Unless indicated otherwise, all dollar figures herein refer to U.S. currency. Yen amounts have been translated into U.S.
dollars, for convenience only, at the rate of ¥106=U.S. $1.
2. Basic earnings per share is computed based on the weighted-average number of shares of common stock outstanding
during the period. Diluted earnings per share assumes the dilution that would occur if dilutive convertible debentures
were converted into common stock.
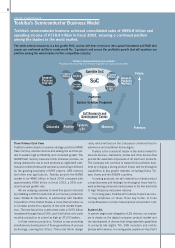
NET SALES &
GROSS PROFIT MARGIN SG&A EXPENSES ROE
NET INCOME (LOSS)
(Billions of yen) (%) (%)(Billions of yen)
Net Sales
Gross Profit Margin
Toshiba Corporation and its subsidiaries
For the years ended March 31, 2004 and 2003
(Billions of yen)