TomTom 2014 Annual Report Download - page 94
Download and view the complete annual report
Please find page 94 of the 2014 TomTom annual report below. You can navigate through the pages in the report by either clicking on the pages listed below, or by using the keyword search tool below to find specific information within the annual report.-
 1
1 -
2
-
3
-
4
-
5
-
6
-
7
-
8
-
9
-
10
-
11
-
12
-
13
-
14
-
15
-
16
-
17
-
18
-
19
-
20
-
21
-
22
-
23
-
24
-
25
-
26
-
27
-
28
-
29
-
30
-
31
-
32
-
33
-
34
-
35
-
36
-
37
-
38
-
39
-
40
-
41
-
42
-
43
-
44
-
45
-
46
-
47
-
48
-
49
-
50
-
51
-
52
-
53
-
54
-
55
-
56
-
57
-
58
-
59
-
60
-
61
-
62
-
63
-
64
-
65
-
66
-
67
-
68
-
69
-
70
-
71
-
72
-
73
-
74
-
75
-
76
-
77
-
78
-
79
-
80
-
81
-
82
-
83
-
 84
84 -
 85
85 -
 86
86 -
 87
87 -
 88
88 -
 89
89 -
 90
90 -
 91
91 -
 92
92 -
 93
93 -
 94
94 -
 95
95 -
 96
96
 |
 |

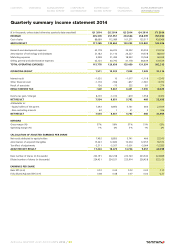
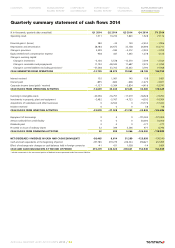
Quarterly summary statement of cash flows 2014
(€ in thousands, quarterly data unaudited) Q1 2014 Q2 2014 Q3 2014 Q4 2014 FY 2014
Operating result 1,511 10,232 7,843 1,528 21,114
Financial gains / (losses) 380 –34 150 –2,452 –1,956
Depreciation and amortisation 28,184 26,673 33,158 26,696 114,711
Change in provisions 5,599 –184 –5,212 –3,905 –3,702
Equity-settled stock compensation expense 938 447 1,463 1,278 4,126
Change in working capital:
Change in inventories –3,156 5,578 –13,570 7,599 –3,549
Change in receivables and prepayments 11,192 –38,045 11,687 3,574 –11,592
Change in current liabilities (excluding provisions)1–57,368 33,703 35,443 3,790 15,568
CASH GENERATED FROM OPERATIONS –12,720 38,370 70,962 38,108 134,720
Interest received 103 1,061 145 158 1,467
Interest paid –895 –824 –628 –1,470 –3,817
Corporate income taxes (paid) / received –1,127 –5,364 –2,834 –4,416 –13,741
CASH FLOWS FROM OPERATING ACTIVITIES –14,639 33,243 67,645 32,380 118,629
Investing in intangible assets –20,396 –16,757 –17,019 –18,528 –72,700
Investments in property, plant and equipment –3,482 –3,767 –4,723 –4,592 –16,564
Acquisitions of subsidiaries and other businesses 0 –6,504 0 –10,776 –17,280
Divident received 0 0 0 58 58
CASH FLOWS FROM INVESTING ACTIVITIES –23,878 –27,028 –21,742 –33,838 –106,486
Repayment of borrowings 0 0 0 –175,000 –175,000
Amount utilised from credit facility 0 0 0 50,000 50,000
Dividends paid 0 0 0 –177 –177
Proceeds on issue of ordinary shares 52 399 5,366 977 6,794
CASH FLOWS FROM FINANCING ACTIVITIES 52 399 5,366 –124,200 –118,383
NET (DECREASE) / INCREASE IN CASH AND CASH EQUIVALENTS –38,465 6,614 51,269 –125,658 –106,240
Cash and cash equivalents at the beginning of period 257,785 219,279 226,324 278,621 257,785
Effect of exchange rate changes on cash balances held in foreign currencies –41 431 1,028 –14 1,404
CASH AND CASH EQUIVALENTS AT THE END OF PERIOD 219,279 226,324 278,621 152,949 152,949
1Includes movements in the non-current portion of deferred revenue presented under Non-current liabilities.
CONTENTS OVERVIEW MANAGEMENT
BOARD REPORT CORPORATE
GOVERNANCE SUPERVISORY
BOARD REPORT FINANCIAL
STATEMENTS SUPPLEMENTARY
INFORMATION
ANNUAL REPORT AND ACCOUNTS 2014 / 94