TomTom 2014 Annual Report Download - page 64
Download and view the complete annual report
Please find page 64 of the 2014 TomTom annual report below. You can navigate through the pages in the report by either clicking on the pages listed below, or by using the keyword search tool below to find specific information within the annual report.-
 1
1 -
2
-
3
-
4
-
5
-
6
-
7
-
8
-
9
-
10
-
11
-
12
-
13
-
14
-
15
-
16
-
17
-
18
-
19
-
20
-
21
-
22
-
23
-
24
-
25
-
26
-
27
-
28
-
29
-
30
-
31
-
32
-
33
-
34
-
35
-
36
-
37
-
38
-
39
-
40
-
41
-
42
-
43
-
44
-
45
-
46
-
47
-
48
-
49
-
50
-
51
-
52
-
53
-
 54
54 -
 55
55 -
 56
56 -
 57
57 -
 58
58 -
 59
59 -
 60
60 -
 61
61 -
 62
62 -
 63
63 -
 64
64 -
 65
65 -
 66
66 -
 67
67 -
 68
68 -
 69
69 -
 70
70 -
 71
71 -
 72
72 -
 73
73 -
 74
74 -
75
-
76
-
77
-
78
-
79
-
80
-
81
-
82
-
83
-
84
-
85
-
86
-
87
-
88
-
89
-
90
-
91
-
92
-
93
-
94
-
95
-
96
 |
 |

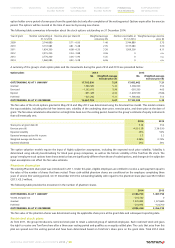
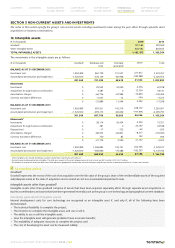
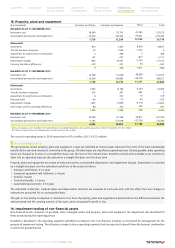
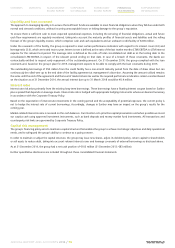
13. Property, plant and equipment
(€ in thousands) Furniture and fixture Computer and harware Other1Total
BALANCE AS AT 31 DECEMBER 2012
Investment cost 18,069 70,703 43,383 132,155
Accumulated amortisation and impairment –16,340 –58,404 –30,641 –105,385
1,729 12,299 12,742 26,770
Movements
Investments 810 7,467 8,600 16,877
Transfer between categories 25 1,500 –1,525 0
Acquisitions through business combination 0 466 0466
Disposals (net) –61 –233 –817 –1,111
Depreciation charges –643 –8,593 –7,779 –17,015
Currency translation differences –122 –151 90 –183
9 456 –1,431 –966
BALANCE AS AT 31 DECEMBER 2013
Investment cost 14,328 51,638 48,089 114,055
Accumulated amortisation and impairment –12,590 –38,883 –36,778 –88,251
1,738 12,755 11,311 25,804
Movements
Investments 1,945 8,186 6,354 16,485
Transfer between categories 270 297 –567 0
Acquisitions through business combination 6 303 10 319
Disposals (net)2–60 –73 –50 –183
Depreciation charges –647 –5,859 –6,116 –12,622
Net foreign currency exchange differences 86 242 163 491
1,600 3,096 –206 4,490
BALANCE AS AT 31 DECEMBER 2014
Investment cost 10,499 53,769 36,811 101,079
Accumulated amortisation and impairment –7,161 –37,918 –25,706 –70,785
3,338 15,851 11,105 30,294
1Other assets balance as at 31 December 2014 mainly comprises of leasehold improvements with a carrying value of €4.2 million (31 December 2013: €5.0 million).
2The total gross amount of the assets disposed across all asset classes was €31.8 million.
The costs for operating leases in 2014 amounted to €13.0 million (2013: €15.5 million).
Accounting policy
The group leases certain property, plant and equipment. Leases are classified as finance leases whenever the terms of the lease substantially
transfer all the risks and rewards of ownership to the group. All other leases are classified as operating leases. Rentals payable under operating
leases are charged to income on a straight-line basis over the term of the relevant lease. Benefits received and receivable as an incentive to
enter into an operating lease are also spread on a straight-line basis over the lease term.
Property, plant and equipment are stated at historical cost less accumulated depreciation and impairment charges. Depreciation is recorded
on a straight-line basis over the estimated useful lives of the assets as follows:
• Furniture and fixtures: 4-10 years
• Computer equipment and hardware: 2-4 years
• Vehicles: 4 years
• Tools and moulds: 1-2 years
• Leasehold improvements: 4-10 years
The estimated useful lives, residual values and depreciation methods are reviewed at each year-end, with the effect that any changes in
estimate are accounted for on a prospective basis.
The gain or loss arising on disposal or retirement of an item of property, plant and equipment is determined as the difference between the
sales proceeds and the carrying amount of the asset, and is recognised in profit or loss.
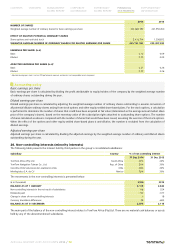
14. Impairment testing of non-financial assets
Non-financial assets comprises of goodwill, other intangible assets and property, plant and equipment. No impairment was identified for
these assets during the reporting period.
Goodwill is allocated to the operating segments identified according to the core business activities as monitored by management for the
purpose of impairment testing. The allocation is made to those operating segments that are expected to benefit from the business combination
in which the goodwill arose.
CONTENTS OVERVIEW MANAGEMENT
BOARD REPORT CORPORATE
GOVERNANCE SUPERVISORY
BOARD REPORT FINANCIAL
STATEMENTS SUPPLEMENTARY
INFORMATION
ANNUAL REPORT AND ACCOUNTS 2014 / 64