TomTom 2014 Annual Report Download - page 75
Download and view the complete annual report
Please find page 75 of the 2014 TomTom annual report below. You can navigate through the pages in the report by either clicking on the pages listed below, or by using the keyword search tool below to find specific information within the annual report.-
 1
1 -
2
-
3
-
4
-
5
-
6
-
7
-
8
-
9
-
10
-
11
-
12
-
13
-
14
-
15
-
16
-
17
-
18
-
19
-
20
-
21
-
22
-
23
-
24
-
25
-
26
-
27
-
28
-
29
-
30
-
31
-
32
-
33
-
34
-
35
-
36
-
37
-
38
-
39
-
40
-
41
-
42
-
43
-
44
-
45
-
46
-
47
-
48
-
49
-
50
-
51
-
52
-
53
-
54
-
55
-
56
-
57
-
58
-
59
-
60
-
61
-
62
-
63
-
64
-
 65
65 -
 66
66 -
 67
67 -
 68
68 -
 69
69 -
 70
70 -
 71
71 -
 72
72 -
 73
73 -
 74
74 -
 75
75 -
 76
76 -
 77
77 -
 78
78 -
 79
79 -
 80
80 -
 81
81 -
 82
82 -
 83
83 -
 84
84 -
 85
85 -
86
-
87
-
88
-
89
-
90
-
91
-
92
-
93
-
94
-
95
-
96
 |
 |

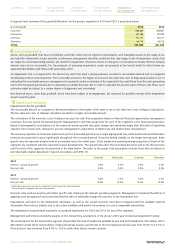
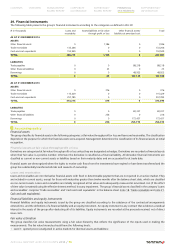
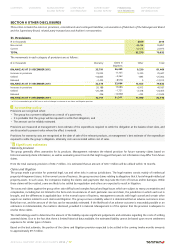
29. Financial instruments
The following table presents the group's financial instruments according to the categories as defined in IAS 39:
(€ in thousands) Loans and
receivables
Assets/liabilities at fair value
through profit or loss
Other financial assets/
liabilities at amortised cost
Total
AS AT 31 DECEMBER 2014
ASSETS
Other financial assets 0 1,186 0 1,186
Trade receivables 133,266 0 0 133,266
Cash and cash equivalents 152,949 0 0 152,949
TOTAL 286,215 1,186 0 287,401
LIABILITIES
Trade payables 0 0 88,218 88,218
Other financial liabilities 0 23 0 23
Borrowings 0 0 48,925 48,925
TOTAL 0 23 137,143 137,166
AS AT 31 DECEMBER 2013
ASSETS
Other financial assets 0 376 0 376
Trade receivables 115,429 0 0 115,429
Cash and cash equivalents 257,785 0 0 257,785
TOTAL 373,214 376 0 373,590
LIABILITIES
Trade payables 0 0 82,337 82,337
Other financial liabilities 0 236 0 236
Borrowings 0 0 173,437 173,437
TOTAL 0 236 255,774 256,010
Accounting policy
Financial assets
The group classifies its financial assets in the following categories: at fair value through profit or loss and loans and receivables. The classification
depends on the purpose for which the financial assets were acquired. Management determines the classification of its financial assets at initial
recognition.
Financial assets at fair value through profit or loss
Derivatives are categorised at fair value through profit or loss unless they are designated as hedges. Derivatives are recorded as financial assets
when their fair value is a positive number; otherwise the derivative is classified as a financial liability. All derivative financial instruments are
classified as current or non-current assets or liabilities based on their maturity dates and are accounted for at trade date.
Financial assets are derecognised when the rights to receive cash flows from the investments have expired or have been transferred and the
group has substantially transferred all risks and rewards of ownership.
Loans and receivables
Loans and receivables are non-derivative financial assets with fixed or determinable payments that are not quoted in an active market. They
are included in current assets, except for those with maturities greater than twelve months after the balance sheet date, which are classified
as non-current assets. Loans and receivables are initially recognised at fair value and subsequently measured at amortised cost (if the effect
of time value is material) using the effective interest method, less any impairment. The group's financial assets classified in the category 'Loans
and receivables' comprise 'Trade receivables' and 'Cash and cash equivalents' in the balance sheet (note 18. Trade receivables and note 21.
Cash and cash equivalents).
Financial liabilities and equity instruments
Financial liabilities and equity instruments issued by the group are classified according to the substance of the contractual arrangements
entered into, and the definitions of a financial liability and an equity instrument. An equity instrument is any contract that evidences a residual
interest in the assets of the group after deducting all of its liabilities. Equity instruments are recorded at the proceeds received, net of direct
issue costs.
Fair value estimation
The group classifies fair value measurements using a fair value hierarchy that reflects the significance of the inputs used in making the
measurements. The fair value hierarchy should have the following levels:
• Level 1: quoted prices (unadjusted) in active markets for identical assets and liabilities;
CONTENTS OVERVIEW MANAGEMENT
BOARD REPORT CORPORATE
GOVERNANCE SUPERVISORY
BOARD REPORT FINANCIAL
STATEMENTS SUPPLEMENTARY
INFORMATION
ANNUAL REPORT AND ACCOUNTS 2014 / 75