TomTom 2009 Annual Report Download - page 75
Download and view the complete annual report
Please find page 75 of the 2009 TomTom annual report below. You can navigate through the pages in the report by either clicking on the pages listed below, or by using the keyword search tool below to find specific information within the annual report.-
 1
1 -
2
-
3
-
4
-
5
-
6
-
7
-
8
-
9
-
10
-
11
-
12
-
13
-
14
-
15
-
16
-
17
-
18
-
19
-
20
-
21
-
22
-
23
-
24
-
25
-
26
-
27
-
28
-
29
-
30
-
31
-
32
-
33
-
34
-
35
-
36
-
37
-
38
-
39
-
40
-
41
-
42
-
43
-
44
-
45
-
46
-
47
-
48
-
49
-
50
-
51
-
52
-
53
-
54
-
55
-
56
-
57
-
58
-
59
-
60
-
61
-
62
-
63
-
64
-
 65
65 -
 66
66 -
 67
67 -
 68
68 -
 69
69 -
 70
70 -
 71
71 -
 72
72 -
 73
73 -
 74
74 -
 75
75 -
 76
76 -
 77
77 -
 78
78 -
 79
79 -
 80
80 -
 81
81 -
 82
82 -
 83
83 -
 84
84 -
 85
85 -
86
-
87
-
88
-
89
-
90
-
91
-
92
-
93
-
94
-
95
-
96
-
97
-
98
-
99
-
100
 |
 |

/ 73
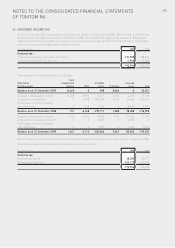
NOTES TO THE CONSOLIDATED FINANCIAL STATEMENTS
OF TOMTOM NV
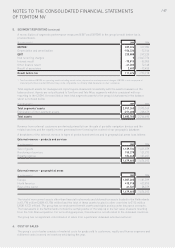
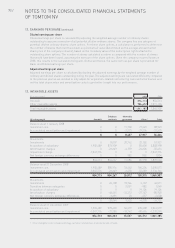
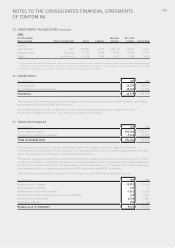
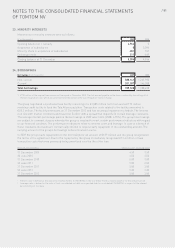
13. INTANGIBLE ASSETS (continued)
All intangible assets besides goodwill have finite useful lives. Goodwill has an indefinite useful life. The database
as acquired at acquisition date represents all stored routing data used for Tele Atlas Maps and has a remaining
useful life of 17 years and 5 months.
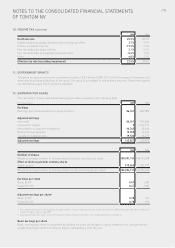
The amortisation charges totalling to €85.9 million (2008: €55.4 million) are included in following line items in the
income statement: amortisation of technology and databases: €75.0 million (2008:€47.7 million); R&D expenses:
€7.6 million (2008: €5.8 million); marketing expenses: €0.4 million (2008: €0.3 million) and selling, general and
administrative expenses: €2.9 million (2008: €1.6 million).
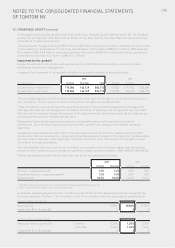
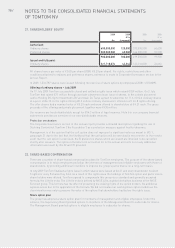
Impairment test for goodwill
Goodwill is allocated to the group’s cash generating units (CGUs) identified according to the core business
activities as monitored by management.
A segment-level summary of the goodwill allocation for our main segments is presented below.
2009 2008
(€ in thousands) TomTom Tele Atlas Total TomTom Tele Atlas Total
Goodwill before impairment 710,584 144,129 854,713 710,584 1,191,905 1,902,489
Goodwill after impairment 710,584 144,129 854,713 710,584 144,129 854,713
The recoverable amount of a CGU is determined based on the higher of the value in use or fair value less cost to
sell calculations. The fair value less cost to sell resulted in a higher recoverable amount.
These calculations use post-tax cash flow projections based on financial forecasts approved by management
covering a four-year period. Management considered the effects of applying a pre-tax approach and concluded
that this will not materially change the outcome of the impairment test. Cash flows beyond the four-year period
are extrapolated using the estimated growth rates.
Management determined budget revenues based on past performance and its expectation of market
development. Discount rates used are post-tax and reflect specific risks relating to the relevant operating
segments.
Management expectations and other input to the calculation such as discount rate, market size and market
shares reflect the current economic climate and market developments relevant to the segments. Insofar possible,
our expectations and input to the impairment calculation have been cross checked with the available external
information from various analysts.
The calculated fair value less costs to sell resulted in a recoverable amount that was higher than the carrying
amount for both segments and accordingly no impairment charge has been recorded in 2009 (2008: €1,048 million).
The key assumptions used for the fair value less cost to sell calculation are as follows:
2009 2008
TomTom Tele Atlas TomTom Tele Atlas
Revenue – perpetual growth¹ 1.2% 1.4% 0.8% 1.8%
Operating expenses – perpetual growth¹ 1.2% 1.4% 0.8% 1.8%
Discount rate² 10.5% 10.5% 10.6% 10.6%
1 Weighted average growth rate used to extrapolate cash flows beyond the forecast period.
2 Post-tax discount rate applied to the cash flow projections.
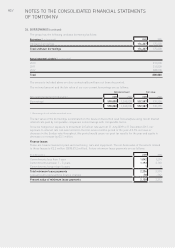
A sensitivity analysis was performed for our discount rate (10.5%) and the perpetual growth percentage for the
two main segments (TomTom: 1.2%, Tele Atlas: 1.4%). The sensitivity of the enterprise value is detailed below:
Sensitivity analysis discount rate
Discount rate 9.50% 10.50% 11.50%
Impairment (€ in thousands) 0 00
Sensitivity analysis perpetual growth
Perpetual revenue growth (%) TomTom 0.20% 1.20% 2.20%
Tele Atlas 0.40% 1.40% 2.40%
Impairment (€ in thousands) 0 00