Tesco 2001 Annual Report Download - page 29
Download and view the complete annual report
Please find page 29 of the 2001 Tesco annual report below. You can navigate through the pages in the report by either clicking on the pages listed below, or by using the keyword search tool below to find specific information within the annual report.-
 1
1 -
2
-
3
-
4
-
5
-
6
-
7
-
8
-
9
-
10
-
11
-
12
-
13
-
14
-
15
-
16
-
17
-
18
-
 19
19 -
 20
20 -
 21
21 -
 22
22 -
 23
23 -
 24
24 -
 25
25 -
 26
26 -
 27
27 -
 28
28 -
 29
29 -
 30
30 -
 31
31 -
 32
32 -
 33
33 -
 34
34 -
 35
35 -
 36
36 -
 37
37 -
 38
38 -
 39
39 -
40
-
41
-
42
-
43
-
44
 |
 |

TESCO PLC 27
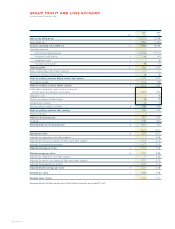
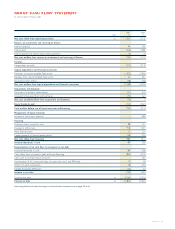
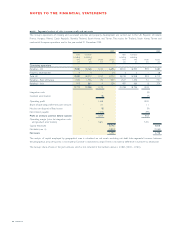
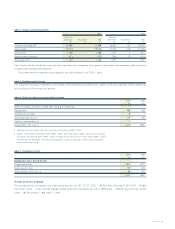
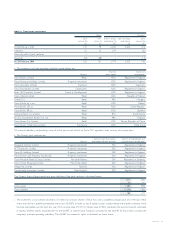
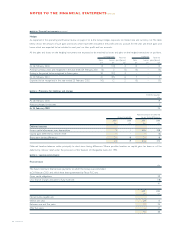
NOTE 9 Dividends
2001 2000 2001 2000
Pence per share Pence per share £m £m
Declared interim 1.48 1.34 101 90
Proposed final 3.50 3.14 239 212
4.98 4.48 340 302
NOTE 10 Earnings per share and diluted earnings per share
Earnings per share and diluted earnings per share have been calculated in accordance with Financial Reporting Standard 14,‘Earnings per Share’.
The standard requires that earnings should be based on the net profit attributable to ordinary shareholders. The calculation for earnings,
including and excluding integration costs, net loss on disposal of fixed assets and goodwill amortisation, is based on the profit for the financial
year of £767m (2000 – £674m).
For the purposes of calculating earnings per share, the number of shares is the weighted average number of ordinary shares in issue during
the year of 6,792 million (2000 – 6,693 million).
The calculation for diluted earnings per share uses the weighted average number of ordinary shares in issue adjusted by the effects of
all dilutive potential ordinary shares. The dilution effect is calculated on the full exercise of all ordinary share options granted by the Group,
including performance based options which the Group consider to have been earned. The calculation compares the difference between
the exercise price of exercisable ordinary share options, weighted for the period over which they were outstanding, with the average daily mid-
market closing price over the period.
2001 2000
million million
Weighted average number of dilutive share options 134 124
Weighted average number of shares in issue in the period 6,792 6,693
Total number of shares for calculating diluted earnings per share 6,926 6,817
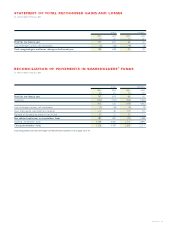
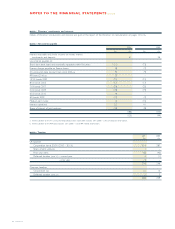
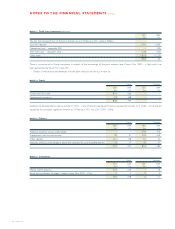
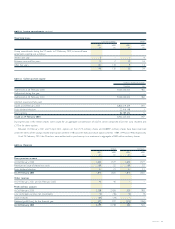
NOTE 11 Intangible fixed assets
Goodwill
£m
Cost
At 26 February 2000 148
Additions at cost (a) 26
At 24 February 2001 174
Amortisation
At 26 February 2000 12
Charge for the period 8
At 24 February 2001 20
Net carrying value
At 24 February 2001 154
At 26 February 2000 136
a Goodwill arising from additional investment in our Thailand business has been capitalised and amortised over 20 years in accordance with the provisions of Financial
Reporting Standard 10, ‘Goodwill and Intangible Assets’.
Goodwill arising from the transactions involving DunnHumby Associates Limited and iVillage UK Limited have been capitalised and amortised
over 20 years in accordance with the provisions of Financial Reporting Standard 9, ‘Associates and Joint Ventures’ and Financial Reporting
Standard 10, ‘Goodwill and Intangible Assets’ and is included in fixed asset investment additions (note 13).