TJ Maxx 2009 Annual Report Download - page 8
Download and view the complete annual report
Please find page 8 of the 2009 TJ Maxx annual report below. You can navigate through the pages in the report by either clicking on the pages listed below, or by using the keyword search tool below to find specific information within the annual report.-
 1
1 -
 2
2 -
 3
3 -
 4
4 -
 5
5 -
 6
6 -
 7
7 -
 8
8 -
 9
9 -
 10
10 -
 11
11 -
 12
12 -
 13
13 -
 14
14 -
 15
15 -
 16
16 -
 17
17 -
 18
18 -
 19
19 -
20
-
21
-
22
-
23
-
24
-
25
-
26
-
27
-
28
-
29
-
30
-
31
-
32
-
33
-
34
-
35
-
36
-
37
-
38
-
39
-
40
-
41
-
42
-
43
-
44
-
45
-
46
-
47
-
48
-
49
-
50
-
51
-
52
-
53
-
54
-
55
-
56
-
57
-
58
-
59
-
60
-
61
-
62
-
63
-
64
-
65
-
66
-
67
-
68
-
69
-
70
-
71
-
72
-
73
-
74
-
75
-
76
-
77
-
78
-
79
-
80
-
81
-
82
-
83
-
84
-
85
-
86
-
87
-
88
-
89
-
90
-
91
-
92
-
93
-
94
-
95
-
96
-
97
-
98
-
99
-
100
-
101
 |
 |

great values through to our customers while
maintaining strong protability. We focus
aggressively on expenses throughout the
operations of our business and our advertis-
ing expenses as a percent of sales are very low
relative to other retailers. Overall, our selling,
general and administrative expenses as a per-
centage of sales have remained essentially even
over the last four years despite rising health-
care and other costs.
In 2009, we undertook a series of actions
to reduce costs by more than $150 million,
which not only helped drive the bottom line,
but also reduced our cost structure in ways
that will benet our business longer term.
is is another reason for our condence in
our strong prot margins being sustainable.
We continue to see meaningful opportunities
to remove costs from our business and
our expectation is to reduce expenses by
$50 - $75 million in 2010. Our “big rock”
cost savings initiatives include non-merchan-
dise procurement, improving eciencies
at our stores and distribution centers,
employing best practices and further improv-
ing our supply chain.
e cost leverage that we are gaining as
we grow our businesses is another major
factor driving our protable growth. Our
younger businesses continue to move toward
their targeted prot margin potentials. As
they expand their store bases, we gain
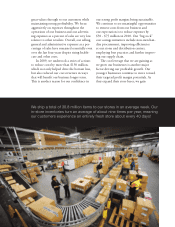
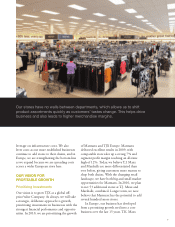
We ship a total of 30.8 million items to our stores in an average week. Our
in-store inventories turn an average of about nine times per year, meaning
our customers experience an entirely fresh store about every 40 days!