Sunoco 2011 Annual Report Download - page 16
Download and view the complete annual report
Please find page 16 of the 2011 Sunoco annual report below. You can navigate through the pages in the report by either clicking on the pages listed below, or by using the keyword search tool below to find specific information within the annual report.-
 1
1 -
2
-
3
-
4
-
5
-
 6
6 -
 7
7 -
 8
8 -
 9
9 -
 10
10 -
 11
11 -
 12
12 -
 13
13 -
 14
14 -
 15
15 -
 16
16 -
 17
17 -
 18
18 -
 19
19 -
 20
20 -
 21
21 -
 22
22 -
 23
23 -
 24
24 -
 25
25 -
 26
26 -
27
-
28
-
29
-
30
-
31
-
32
-
33
-
34
-
35
-
36
-
37
-
38
-
39
-
40
-
41
-
42
-
43
-
44
-
45
-
46
-
47
-
48
-
49
-
50
-
51
-
52
-
53
-
54
-
55
-
56
-
57
-
58
-
59
-
60
-
61
-
62
-
63
-
64
-
65
-
66
-
67
-
68
-
69
-
70
-
71
-
72
-
73
-
74
-
75
-
76
-
77
-
78
-
79
-
80
-
81
-
82
-
83
-
84
-
85
-
86
-
87
-
88
-
89
-
90
-
91
-
92
-
93
-
94
-
95
-
96
-
97
-
98
-
99
-
100
-
101
-
102
-
103
-
104
-
105
-
106
-
107
-
108
-
109
-
110
-
111
-
112
-
113
-
114
-
115
-
116
-
117
-
118
-
119
-
120
-
121
-
122
-
123
-
124
-
125
-
126
-
127
-
128
-
129
-
130
-
131
-
132
-
133
-
134
-
135
-
136
 |
 |

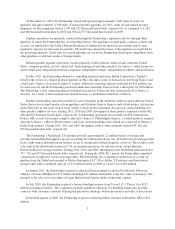
The following table sets forth information concerning the Company’s refinery operations (excluding
discontinued Tulsa operations) during the last three years (in thousands of barrels daily and percentages):
2011 2010 2009
Crude Unit Capacity at December 31* ............................. 505.0 675.0 675.0
Crude Inputs as Percent of Crude Unit Rated Capacity ................. 82% 87% 78%
Conversion Capacity at December 31 .............................. 230.0 343.0 343.0
Conversion Capacity Utilized .................................... 79% 87% 79%
Throughputs:
Crude Oil .................................................. 436.2 588.8 625.4
Other Feedstocks ............................................ 46.9 56.4 70.8
Total Throughputs ......................................... 483.1 645.2 696.2
Products Manufactured:
Gasoline ................................................... 245.8 337.0 357.9
Middle Distillates ............................................ 173.5 230.6 225.3
Residual Fuel ............................................... 30.0 34.6 59.2
Petrochemicals .............................................. 14.4 23.4 27.3
Other ...................................................... 38.1 48.5 54.7
Total Production ........................................... 501.8 674.1 724.4
Less Production Used as Fuel in Refinery Operations ................ 23.9 31.3 34.5
Total Production Available for Sale ............................ 477.9 642.8 689.9
*Includes 175 thousand barrels-per-day of capacity at the Marcus Hook refinery which has been indefinitely idled and reflects a 170 thousand
barrels-per-day reduction attributable to the sale of the Toledo refinery in March 2011.
Sunoco has met all of its crude oil requirements through purchases from third parties. There has been an
ample supply of crude oil available to meet worldwide refining needs, and Sunoco has been able to supply its
refineries with the proper mix and quality of crude oils without material disruption. Most of the crude oil
processed at Sunoco’s refineries is light-sweet crude oil. The Company also processes limited amounts of
discounted high-acid sweet crude oils in its Northeast refineries. During 2011, 2010 and 2009, approximately 39,
44 and 61 thousand barrels per day, respectively, of such crude oils were processed.
The Northeast Refineries have processed crude oils supplied from foreign sources which has been delivered
utilizing ocean-going tankers and coastal distribution tankers and barges that are owned and operated by third
parties. Approximately 25 percent of the Company’s ocean-going tanker marine transportation requirements
pertaining to its crude supply has been met through time charters.
Approximately 50 percent of Sunoco’s crude oil supply for its Philadelphia and Marcus Hook refineries
came from Nigeria during 2011. Some of the crude oil producing areas of this West African country have
experienced political and ethnic violence as well as labor disruptions in recent years, which has resulted in the
shutdown of a small portion of total Nigerian crude oil production during that time. The lost crude oil production
in Nigeria did not have a material impact on Sunoco’s operations. From time to time, Sunoco has used other
sweet crude oil alternatives in addition to the Nigerian grades.
8