Sunoco 2003 Annual Report Download - page 5
Download and view the complete annual report
Please find page 5 of the 2003 Sunoco annual report below. You can navigate through the pages in the report by either clicking on the pages listed below, or by using the keyword search tool below to find specific information within the annual report.-
 1
1 -
 2
2 -
 3
3 -
 4
4 -
 5
5 -
 6
6 -
 7
7 -
 8
8 -
 9
9 -
 10
10 -
 11
11 -
 12
12 -
 13
13 -
 14
14 -
 15
15 -
 16
16 -
17
-
18
-
19
-
20
-
21
-
22
-
23
-
24
-
25
-
26
-
27
-
28
-
29
-
30
-
31
-
32
-
33
-
34
-
35
-
36
-
37
-
38
-
39
-
40
-
41
-
42
-
43
-
44
-
45
-
46
-
47
-
48
-
49
-
50
-
51
-
52
-
53
-
54
-
55
-
56
-
57
-
58
-
59
-
60
-
61
-
62
-
63
-
64
-
65
-
66
-
67
-
68
-
69
-
70
-
71
-
72
-
73
-
74
 |
 |

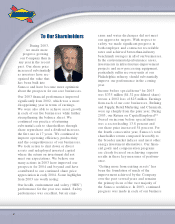
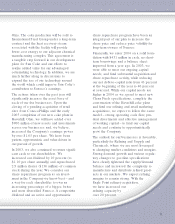
units and we can and will do more in 2004
and beyond.
In Refining and Supply, we achieved record
production for the third consecutive year,
with an increase of over 15 million barrels
since 2000. We also continued to improve
the overall utilization and energy performance
throughout our refining system. The com-
petitiveness of our refineries, as measured
by industry benchmarking rankings, has
improved significantly and is now in the first
or second quartiles in most important
measures. In the current high commodity
price and margin environment, these
improvements translate into significant
savings and earnings for the business. In
early 2004, we completed the acquisition
of the Eagle Point refinery. This is our first
refinery acquisition since 1994 and is one
of the more cost-effective refinery acquisi-
tions in the industry in many years.
In Retail Marketing, we continued to grow
per-site fuel and merchandise sales,
expanded the footprint of the Sunoco®
brand, and effectively concluded a retail
divestment program in MidAmerica where
we sold our interests in certain sites into
the Sunoco distributor channel. In doing
so, we retained all the volumes within the
Sunoco®brand and harvested $46 million
in proceeds while improving the return on
invested capital for the business. This effort
is reflective of our strategy to high-grade
our retail portfolio and have Sunoco capital
invested only in sites and markets that will
yield an acceptable return well into the
future.
In Chemicals, significant productivity
enhancements and strategic actions were
taken to improve the future profitability of
the business. Manufacturing complement
has been reduced, low economic return
units in both phenol and polypropylene
have been shut down or mothballed, and,
like Refining and Supply, the competitive
standing of our facilities has been
improved. Also, the sale of the plasticizers
business in early 2004 is an excellent port-
folio management outcome for Chemicals –
garnering $90 million in divestment pro-
ceeds for a non-core part of the chemicals
business that had earned an average of
only $3 million over the past three years.
In Logistics, the value of our interest in
Sunoco Logistics Partners L.P. (NYSE:
SXL) grew by 54 percent in 2003. Since
the February 2002 initial public offering,
SXL distributions have increased from
3
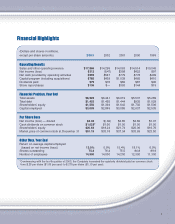
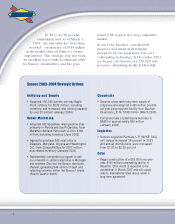
Sunoco 2003 Financial Highlights
• Income before special items* of $335 million or
$4.32 per diluted share
• Sector-leading Return on Capital Employed of
13.8 percent (based on income before special
items)* *
• Share price increase of 54 percent, reaching new
record highs
• Increased annual dividend from $1.00 to $1.10
per share
• Repurchased 2.9 million, or 4 percent, of
outstanding shares
* Net income (loss) for 2003 and 2002 amounted to $312 and $(47) million,
respectively, which includes net charges for special items of $23 and $22
million, respectively.
* * ROCE for 2003 (based on net incom e) was 13.0 percent.