Sunoco 2003 Annual Report Download - page 16
Download and view the complete annual report
Please find page 16 of the 2003 Sunoco annual report below. You can navigate through the pages in the report by either clicking on the pages listed below, or by using the keyword search tool below to find specific information within the annual report.-
 1
1 -
2
-
3
-
4
-
5
-
 6
6 -
 7
7 -
 8
8 -
 9
9 -
 10
10 -
 11
11 -
 12
12 -
 13
13 -
 14
14 -
 15
15 -
 16
16 -
 17
17 -
 18
18 -
 19
19 -
 20
20 -
 21
21 -
 22
22 -
 23
23 -
 24
24 -
 25
25 -
 26
26 -
27
-
28
-
29
-
30
-
31
-
32
-
33
-
34
-
35
-
36
-
37
-
38
-
39
-
40
-
41
-
42
-
43
-
44
-
45
-
46
-
47
-
48
-
49
-
50
-
51
-
52
-
53
-
54
-
55
-
56
-
57
-
58
-
59
-
60
-
61
-
62
-
63
-
64
-
65
-
66
-
67
-
68
-
69
-
70
-
71
-
72
-
73
-
74
 |
 |

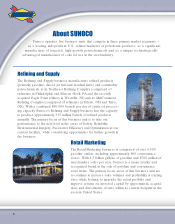
Tulsa refinery, which are sold into the process oil, wholesale base oil and wax markets. A re-
finery in Westville, NJ (also known as the Eagle Point refinery), which manufactures petro-
leum products and commodity petrochemicals, was acquired in January 2004 (see below).
Refining operations are organized into two refining centers. The Northeast Refining Com-
plex is comprised of the Marcus Hook, Philadelphia and Eagle Point refineries, while the
MidContinent Refining Complex is comprised of the Toledo and Tulsa refineries.
2003 2002 2001
Income (loss) (millions of dollars) $261 $(31) $290
Wholesale margin* (per barrel):
Total Refining and Supply $4.76 $2.83 $4.77
Northeast Refining Complex $4.63 $2.47 $3.98
MidContinent Refining Complex $5.05 $3.69 $6.54
Throughputs (thousands of barrels daily):
Crude oil 708.1 689.9 687.7
Other feedstocks 53.2 58.4 47.9
Total throughputs 761.3 748.3 735.6
Products manufactured (thousands of barrels daily):
Gasoline 375.6 375.2 356.1
Middle distillates 236.7 231.2 230.0
Residual fuel 59.8 55.9 56.4
Petrochemicals 27.9 30.5 30.0
Lubricants 13.6 13.1 12.2
Other 77.6 73.4 82.5
Total production 791.2 779.3 767.2
Less: Production used as fuel in refinery operations 37.1 37.0 37.0
Total production available for sale 754.1 742.3 730.2
Crude unit capacity (thousands of barrels daily) at
December 31** 730.0 730.0 730.0
Crude unit capacity utilized 97% 95% 94%
Conversion capacity*** (thousands of barrels daily) at
December 31 306.7 306.7 306.7
Conversion capacity utilized 98% 95% 90%
* Wholesale sales price less cost of crude oil, other feedstocks, product purchases, internally produced fuel and related terminalling and
transportation divided by production available for sale. Prior-year amounts have been restated to conform to the current-year
presentation.
** In January 2004, crude unit capacity increased to 890 thousands of barrels daily. This change reflects the acquisition of the 150
thousand barrels-per-day Eagle Point refinery and a 10 thousand barrels-per-day adjustment at the Toledo refinery reflecting the
increased reliability and enhanced operations at this facility in recent years.
*** Represents capacity to upgrade lower-value, heavier petroleum products into higher-value, lighter products. In January 2004,
conversion capacity increased to 361.7 thousands of barrels daily as a result of the Eagle Point refinery acquisition.
Refining and Supply segment results increased $292 million in 2003 primarily due to sig-
nificantly higher margins ($339 million) and a 2 percent increase in total production vol-
umes ($13 million). The margin improvement resulted largely from lowindustry inventory
levels, stronger product demand, the exceptionally cold winter weather in early 2003 and
industry-related operating problems in part due to an electrical power failure in the North-
east. Partially offsetting these positive factors were higher expenses ($53 million), primarily
refinery fuel and utility costs and employee-related expenses.
Refining and Supply segment results decreased $321 million in 2002 due to significantly
lower realized margins ($341 million) compared to the strong levels in 2001, partially off-
set by higher production volumes ($9 million) and a benefit attributable to LIFO inventory
profits ($5 million). The margin decline resulted largely from rising crude oil prices
throughout the year and high industry inventory levels. Warmer winter weather in early
2002, reduced jet fuel demand and much lower natural gas prices also impacted margins for
14