Sunbeam 2010 Annual Report Download - page 2
Download and view the complete annual report
Please find page 2 of the 2010 Sunbeam annual report below. You can navigate through the pages in the report by either clicking on the pages listed below, or by using the keyword search tool below to find specific information within the annual report.-
 1
1 -
 2
2 -
 3
3 -
 4
4 -
 5
5 -
 6
6 -
 7
7 -
 8
8 -
 9
9 -
 10
10 -
 11
11 -
 12
12 -
 13
13 -
14
-
15
-
16
-
17
-
18
-
19
-
20
-
21
-
22
-
23
-
24
-
25
-
26
-
27
-
28
-
29
-
30
-
31
-
32
-
33
-
34
-
35
-
36
-
37
-
38
-
39
-
40
-
41
-
42
-
43
-
44
-
45
-
46
-
47
-
48
-
49
-
50
-
51
-
52
-
53
-
54
-
55
-
56
-
57
-
58
-
59
-
60
-
61
-
62
-
63
-
64
-
65
-
66
-
67
-
68
-
69
-
70
-
71
-
72
 |
 |

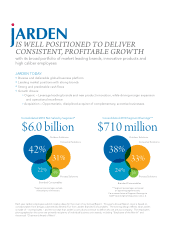
IS WELL POSITIONED TO DELIVER
CONSISTENT, PROFITABLE GROWTH
with its broad portfolio of market leading brands, innovative products and
high caliber employees
JARDEN TODAY:
o Diverse and defensible global business platform
o Leading market positions with strong brands
o Strong and predictable cash flows
o Growth drivers:
o Organic – Leverage leading brands and new product innovation, while driving margin expansion
and operational excellence
o Acquisition – Opportunistic, disciplined acquirer of complementary, accretive businesses
Each year Jarden employees submit creative ideas for the cover of our Annual Report. This year’s Annual Report cover is based on
concepts taken from designs submitted by Beverly Furr from Jarden Branded Consumables. The winning design reflects what Jarden
is made of – its employees – and the concept that Jarden’s core values continue to define who we are as a company. The employees
photographed on the cover are primarily recipients of individual business unit awards, including “Employee of the Month” and
the annual “Chairman’s Award of Merit”.
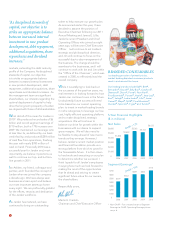
* Segment percentages exclude
intercompany eliminations.
** Segment percentages are based
on operating segments only.
For a reconciliation of Segment Earnings to
GAAP Operating Earnings please see p. 6.
42%
31%
22% 5%
38%
33%
24% 5%
$
6.0 billion
$
710 million
Outdoor SolutionsOutdoor Solutions
Consumer Solutions Consumer Solutions
Branded Consumables
Branded Consumables
Process SolutionsProcess Solutions
Consolidated 2010 Net Sales by Segment* Consolidated 2010 Segment Earnings**