Sunbeam 2010 Annual Report Download - page 13
Download and view the complete annual report
Please find page 13 of the 2010 Sunbeam annual report below. You can navigate through the pages in the report by either clicking on the pages listed below, or by using the keyword search tool below to find specific information within the annual report.-
 1
1 -
2
-
 3
3 -
 4
4 -
 5
5 -
 6
6 -
 7
7 -
 8
8 -
 9
9 -
 10
10 -
 11
11 -
 12
12 -
 13
13 -
 14
14 -
 15
15 -
 16
16 -
 17
17 -
 18
18 -
 19
19 -
 20
20 -
 21
21 -
 22
22 -
 23
23 -
24
-
25
-
26
-
27
-
28
-
29
-
30
-
31
-
32
-
33
-
34
-
35
-
36
-
37
-
38
-
39
-
40
-
41
-
42
-
43
-
44
-
45
-
46
-
47
-
48
-
49
-
50
-
51
-
52
-
53
-
54
-
55
-
56
-
57
-
58
-
59
-
60
-
61
-
62
-
63
-
64
-
65
-
66
-
67
-
68
-
69
-
70
-
71
-
72
 |
 |
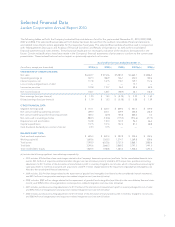
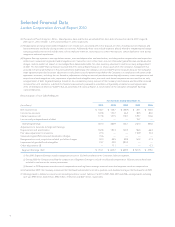
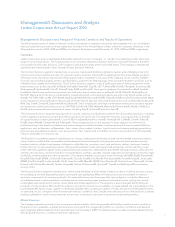
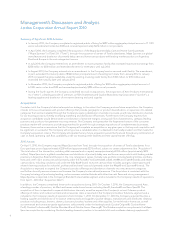
Management’s Discussion and Analysis
Jarden Corporation Annual Report 2010
Cost of sales increased $657 million to $4.4 billion for 2010 versus the same prior year period. The increase is primarily due to
the Acquisition (approximately $342 million), improved sales and the inclusion of a $27.4 million charge during 2010, related to
a purchase accounting adjustment, primarily due to the Acquisition, for the elimination of manufacturer’s profit in inventory that
requires the fair value of the inventory acquired to be valued at the sales price of the finished inventory, less costs to complete
and a reasonable profit allowance for selling effort. Cost of sales as a percentage of net sales for 2010 and 2009 was 72.8% and
72.3%, respectively (72.3% for 2010 excluding the charge for the elimination of manufacturer’s profit in inventory). Cost of sales as
a percentage of net sales for 2010 was negatively affected as a result of the currency devaluation in Venezuela (see “Venezuela
Operations”). Cost of sales as a percentage of net sales for 2009 was also negatively affected by the sell through during the first
quarter of 2009 of higher cost inventory that was built in 2008 during a significant rise in commodity prices.
SG&A increased $248 million, or 25.7%, to $1.2 billion for 2010 versus the same prior year period. The change is primarily due to the
Acquisition; $70.6 million of charges related to the Company’s Venezuela operations (see “Venezuela Operations”); and acquisition-
related and other charges ($33.8 million), primarily associated with acquisitions, partially offset by a decrease in stock-based
compensation ($17.0 million) and gains recognized on derivatives not designated as effective hedges ($10.6 million). Additionally,
the Company recorded a fair value adjustment related to the recovery of a long-term note from a prior investment, partially offset by
a fair value adjustment of a lease termination.
Operating earnings for 2010 in the Outdoor Solutions segment increased $67.0 million, or 41.5%, versus the same prior year period
primarily due to a net gross margin increase (approximately $45 million) due to higher sales, partially offset by other costs and a
$48.5 million decrease in reorganization costs, partially offset by an increase in SG&A ($26.5 million). Operating earnings for 2010
in the Consumer Solutions segment decreased $27.0 million, or 10.4%, versus the same prior year period primarily as the result
of the unfavorable impact on gross margins (approximately $52 million) primarily related to the currency devaluation in Venezuela
(see “Venezuela Operations”), partially offset by a gross margin increase (approximately $25 million) due to higher sales and a
$3.8 million decrease in reorganization costs. Operating earnings for 2010 in the Branded Consumables segment increased $49.0
million, or 81.7%, versus the same prior year period primarily due to the impact of the Acquisition, a net gross margin increase
(approximately $10 million) due to higher sales, a $4.9 million decrease in SG&A, excluding the impact of the Acquisition and
a decrease in impairment charges for goodwill and intangible assets ($3.8 million), partially offset by the purchase accounting
adjustment for the elimination of manufacturer’s profit in inventory ($24.7 million). Operating earnings for 2010 in the Process
Solutions segment increased $6.3 million, or 33.7%, versus the same prior year period primarily as the result of the gross margin
impact of higher sales, partially offset by an increase in SG&A ($6.7 million).
For 2010, the Company did not incur any reorganization costs as the reorganization plans from prior periods have been completed.
For 2009, reorganization costs were $52.3 million. The majority of these charges ($48.5 million) relate to plans initiated for 2009 to
rationalize the overall cost structure of the Outdoor Solutions segment. The Company also recorded reorganization costs ($3.8
million) during 2009 within the Consumer Solutions segment for headcount reductions related to cost reduction initiatives.
During 2010, the Company recorded non-cash charges of $19.7 million to reflect the impairment of goodwill and certain intangible
assets. The most significant of which was a non-cash charge of $17.3 million recorded during the second quarter of 2010 within the
Branded Consumables segment to reflect impairment of goodwill in this segment’s Arts and Crafts business. The impairment was
due to a decrease in the fair value of forecasted cash flows, reflecting the deterioration of revenues and margins due to a decline in
2010 of forecasted sales to a major customer.
Net interest expense increased by $30.3 million to $178 million for 2010 versus the same prior year period due to higher levels of
outstanding debt versus the same prior year period and an increase in the Company’s weighted average interest rate for 2010 to
5.8% from 5.4% in 2009.
The Company’s reported tax rate for 2010 and 2009 was 53.5% and 46.2%, respectively. The increase from the statutory tax rate
to the reported tax rate for 2010 results principally from the tax expense ($29.7 million) due to non-deductible charges primarily
related to the currency devaluation in Venezuela and from the translation of U.S. dollar denominated net assets in Venezuela (see
“Venezuela Operations”) and a tax charge ($7.2 million) related to non-deductible transaction costs attributable to the Acquisition,
partially offset by the tax benefit ($14.2 million) related to the reversal of a deferred tax liability attributable to the reduction of
Venezuelan earnings considered as not permanently reinvested. The difference from the statutory tax rate to the reported tax
rate for 2009 results principally from the U.S. tax expense of $25.7 million recognized on the undistributed foreign income, and
$18.5 million recognized on the distributed foreign income, less a $12.9 million benefit attributable to local Venezuela inflationary
adjustments and tax-exempt earnings.
Net income for 2010 deceased $22.0 million to $107 million versus the same prior year period. For 2010 and 2009, diluted earnings
per share were $1.19 and $1.52, respectively. The decrease in net income was primarily due to the non-cash charges related to the
Company’s Venezuela operations ($70.6 million), the purchase accounting adjustment for the elimination of manufacturer’s profit
in inventory ($27.4 million), acquisition-related and other charges ($42.3 million) and an increase in interest expense ($30.3 million),
partially offset by higher sales, incremental earnings from the Acquisition and a decrease in reorganization costs ($52.3 million).
11