Sunbeam 2010 Annual Report Download - page 12
Download and view the complete annual report
Please find page 12 of the 2010 Sunbeam annual report below. You can navigate through the pages in the report by either clicking on the pages listed below, or by using the keyword search tool below to find specific information within the annual report.-
 1
1 -
 2
2 -
 3
3 -
 4
4 -
 5
5 -
 6
6 -
 7
7 -
 8
8 -
 9
9 -
 10
10 -
 11
11 -
 12
12 -
 13
13 -
 14
14 -
 15
15 -
 16
16 -
 17
17 -
 18
18 -
 19
19 -
 20
20 -
 21
21 -
 22
22 -
23
-
24
-
25
-
26
-
27
-
28
-
29
-
30
-
31
-
32
-
33
-
34
-
35
-
36
-
37
-
38
-
39
-
40
-
41
-
42
-
43
-
44
-
45
-
46
-
47
-
48
-
49
-
50
-
51
-
52
-
53
-
54
-
55
-
56
-
57
-
58
-
59
-
60
-
61
-
62
-
63
-
64
-
65
-
66
-
67
-
68
-
69
-
70
-
71
-
72
 |
 |

Management’s Discussion and Analysis
Jarden Corporation Annual Report 2010
Results of Operations—Comparing 2010 to 2009
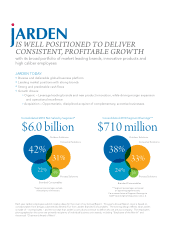
Net sales for 2010 increased $870 million, or 16.9%, to $6.0 billion versus the same prior year period. The overall increase in net
sales was primarily due to the Acquisition (approximately $539 million), improved retail environment, favorable weather conditions,
improved point of sale in certain product categories, expanded product offerings, and increased demand internationally, partially
offset by unfavorable foreign currency translation of approximately $42 million, which includes the unfavorable foreign currency
translation of approximately $88 million related to the currency devaluation in Venezuela (see “Venezuela Operations”). Net sales
in the Outdoor Solutions segment increased $207 million, or 9.0%, primarily as the result of improved sales in the Coleman and
fishing businesses; improved sales in the winter sports and technical apparel businesses, due primarily to increased category space
at certain major domestic retailers; expanded product offerings; increased point of sales, increased demand internationally; overall
economic improvement, favorable weather conditions and favorable foreign currency translation (approximately $14 million);
partially offset by the exiting of two business lines (approximately $54 million). Net sales in the Consumer Solutions segment
increased $33.7 million, or 1.8%, primarily as the result of increased demand domestically, especially in the beverage and food
preparation categories and certain personal care and wellness categories, which is primarily due to new product placements;
increased point of sales; increased sell through for seasonal products at certain major retailers; increased demand internationally,
excluding Venezuela, primarily due to overall economic improvement, new institutional sales and increased promotional
activity; offset by unfavorable foreign currency translation (approximately $61 million), which includes the unfavorable impact
of approximately $81 million related to the currency devaluation in Venezuela (see “Venezuela Operations”). Net sales in the
Branded Consumables segment increased $553 million, or 69.8%, which is mainly due to the Acquisition, improvements in the
safety and security business and new product placements, including safes and shredders and favorable foreign currency translation
(approximately $6 million). Net sales in the Process Solutions segment increased 30.5% on a year over year basis, primarily due to an
increase in the pass through pricing of commodities and increases in coinage and monofilament due to improved market conditions.
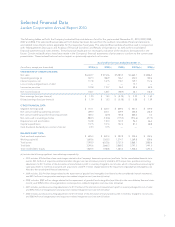
Consolidated Results of Operations
Net Sales
Operating Earnings
(Loss)
Years Ended December 31,
(In millions) 2010 2009 2010 2009
Outdoor Solutions $ 2,518.7 $ 2,311.8 $ 228.6 $ 161.6
Consumer Solutions 1,869.6 1,835.9 233.4 260.4
Branded Consumables 1,345.3 792.1 109.0 60.0
Process Solutions 342.7 262.6 25.0 18.7
Corporate — — (188.7) (113.8)
Intercompany eliminations (53.6) (49.8) — —
$ 6,022.7 $ 5,152.6 $ 407.3 $ 386.9
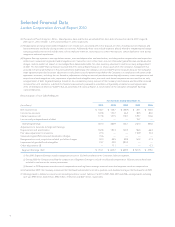
Years Ended December 31,
(In millions) 2010 2009 2008
Net sales $ 6,022.7 $ 5,152.6 $ 5,383.3
Cost of sales 4,383.9 3,726.6 3,880.5
Gross profit 1,638.8 1,426.0 1,502.8
Selling, general and administrative expenses 1,211.8 963.9 1,013.7
Reorganization and acquisition-related integration costs, net — 52.3 59.8
Impairment of goodwill and intangibles 19.7 22.9 283.2
Operating earnings 407.3 386.9 146.1
Interest expense, net 177.8 147.5 178.7
Income (loss) before taxes 229.5 239.4 (32.6)
Income tax provision 122.8 110.7 26.3
Net income (loss) $ 106.7 $ 128.7 $ (58.9)
10