Sonic 2013 Annual Report Download - page 3
Download and view the complete annual report
Please find page 3 of the 2013 Sonic annual report below. You can navigate through the pages in the report by either clicking on the pages listed below, or by using the keyword search tool below to find specific information within the annual report.-
 1
1 -
 2
2 -
 3
3 -
 4
4 -
 5
5 -
 6
6 -
 7
7 -
 8
8 -
 9
9 -
 10
10 -
 11
11 -
 12
12 -
 13
13 -
 14
14 -
15
-
16
-
17
-
18
-
19
-
20
-
21
-
22
-
23
-
24
-
25
-
26
-
27
-
28
-
29
-
30
-
31
-
32
-
33
-
34
-
35
-
36
-
37
-
38
-
39
-
40
-
41
-
42
-
43
-
44
-
45
-
46
-
47
-
48
-
49
-
50
-
51
-
52
-
53
-
54
-
55
-
56
-
57
-
58
 |
 |

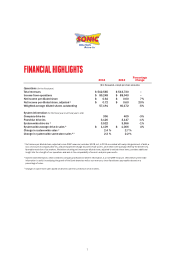
FINANCIALHIGHLIGHTS
Percentage
2013 2012 Change
($ in thousands, except per share amounts)
Operations (for the fiscal year)
Total revenues $ 542,585 $ 543,730 --
Income from operations $ 89,248 $ 88,940 --
Net income per diluted share $ 0.64 $ 0.60 7%
Net income per diluted share, adjusted 1$ 0.72 $ 0.60 20%
Weighted average diluted shares outstanding 57,191 60,172 -5%
System Information (for the fiscal year or at fiscal year’s end)
Company drive-ins 396 409 -3%
Franchise drive-ins 3,126 3,147 -1%
System-wide drive-ins 23,522 3,556 -1%
System-wide average drive-in sales 2$ 1,109 $ 1,066 4%
Change in system-wide sales 22.4 % 2.7 %
Change in system-wide same-store sales 2,3 2.3 % 2.2 %
1Net income per diluted share, adjusted (a non-GAAP measure) excludes $0.08, net, in 2013 associated with early extinguishment of debt, a
loss on closure of company drive-ins, and an impairment charge for point-of-sale assets, all of which were partially offset by the benefit of a
favorable resolution of tax matters. We believe showing net income per diluted share, adjusted to exclude these items, provides additional
insight into the strength of our operations and aids in the comparability of current- and prior-year results.
2System-wide information, which combines company and franchise drive-in information, is a non-GAAP measure. We believe system-wide
information is useful in analyzing the growth of the Sonic brand as well as our revenues, since franchisees pay royalties based on a
percentage of sales.
3Changes in same-store sales based on drive-ins open for a minimum of 15 months.
1