Singapore Airlines 2016 Annual Report Download - page 60
Download and view the complete annual report
Please find page 60 of the 2016 Singapore Airlines annual report below. You can navigate through the pages in the report by either clicking on the pages listed below, or by using the keyword search tool below to find specific information within the annual report.-
 1
1 -
2
-
3
-
4
-
5
-
6
-
7
-
8
-
9
-
10
-
11
-
12
-
13
-
14
-
15
-
16
-
17
-
18
-
19
-
20
-
21
-
22
-
23
-
24
-
25
-
26
-
27
-
28
-
29
-
30
-
31
-
32
-
33
-
34
-
35
-
36
-
37
-
38
-
39
-
40
-
41
-
42
-
43
-
44
-
45
-
46
-
47
-
48
-
49
-
 50
50 -
 51
51 -
 52
52 -
 53
53 -
 54
54 -
 55
55 -
 56
56 -
 57
57 -
 58
58 -
 59
59 -
 60
60 -
 61
61 -
 62
62 -
 63
63 -
 64
64 -
 65
65 -
 66
66 -
 67
67 -
 68
68 -
 69
69 -
 70
70 -
71
-
72
-
73
-
74
-
75
-
76
-
77
-
78
-
79
-
80
-
81
-
82
-
83
-
84
-
85
-
86
-
87
-
88
-
89
-
90
-
91
-
92
-
93
-
94
-
95
-
96
-
97
-
98
-
99
-
100
-
101
-
102
-
103
-
104
-
105
-
106
-
107
-
108
-
109
-
110
-
111
-
112
-
113
-
114
-
115
-
116
-
117
-
118
-
119
-
120
-
121
-
122
-
123
-
124
-
125
-
126
-
127
-
128
-
129
-
130
-
131
-
132
-
133
-
134
-
135
-
136
-
137
-
138
-
139
-
140
-
141
-
142
-
143
-
144
-
145
-
146
-
147
-
148
-
149
-
150
-
151
-
152
-
153
-
154
-
155
-
156
-
157
-
158
-
159
-
160
-
161
-
162
-
163
-
164
-
165
-
166
-
167
-
168
-
169
-
170
-
171
-
172
-
173
-
174
-
175
-
176
-
177
-
178
-
179
-
180
-
181
-
182
-
183
-
184
-
185
-
186
-
187
-
188
-
189
-
190
-
191
-
192
-
193
-
194
-
195
-
196
-
197
-
198
-
199
-
200
-
201
-
202
-
203
-
204
-
205
-
206
-
207
-
208
-
209
-
210
-
211
-
212
-
213
-
214
-
215
-
216
-
217
-
218
-
219
-
220
-
221
-
222
-
223
-
224
-
225
-
226
-
227
-
228
-
229
-
230
-
231
-
232
 |
 |

Financial Review
Performance of the Company
(continued)
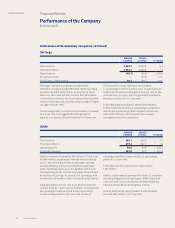
SIA Cargo’s full year operating loss widened by
$28 million compared with FY2014/15. While operating
expenses declined $168 million, mainly due to lower
fuel costs, this could not fully cushion the $196 million
contraction in revenue, which was driven down by yield
erosion of 11.6 per cent, partially oset by higher freight
carriage (+2.6 per cent).
Overall cargo traic (in load tonne kilometers) increased
by 2.6 per cent, but lagged behind the growth in
capacity (in capacity tonne kilometers) of 4.9 per cent.
This resulted in cargo load factor declining by
1.4 percentage points to 61.9 per cent. Cargo breakeven
load factor remained unchanged at 65.2 per cent as the
yield decline (-11.6 per cent) was generally matched by
the drop in unit cost (-11.7 per cent).
Profit aer taxation included a refund amounting to
EUR76 million ($119 million), comprising a competition
law fine paid previously to the European Commission,
with interest therein, with respect to the air cargo
investigations by the Commission.
SilkAir’s revenue increased by $64 million (+7.0 per cent
to $966 million, as passenger revenue was boosted by
an 11.1 per cent improvement in passenger carriage,
partially oset by a 2.9 per cent decline in passenger
yield. Operating expenses rose in tandem with 9.1 per
cent capacity growth, but this was largely compensated
for by fuel cost savings. As a result, the operating profit
increased by $50 million (+122.1 per cent) to $91 million.
Yield declined by 2.9 per cent to 13.5¢/pkm and unit
cost declined by 7.2 per cent to 9.0¢/ask. Consequently,
the passenger breakeven load factor improved by
3.1 percentage points to 66.7 per cent. Achieved
passenger load factor improved by 1.3 percentage
points to 71.5 per cent.
Profit aer taxation improved 127.2 per cent to
$122 million.
SilkAir’s route network spanned 49 cities in 13 countries
including Singapore. During the year, SilkAir launched
new services to Cairns (Australia) and Male (Maldives),
and ceased operations to Hangzhou (China).
As at 31 March 2016, equity holders’ funds of SilkAir
stood at $951 million (+14.7 per cent).
SilkAir
2015/16
$ million
2014/15
$ million % Change
Total revenue 965.7 902.5 + 7.0
Total expenditure 875.1 861.7 + 1.6
Operating profit 90.6 40.8 + 122.1
Profit after taxation 122.0 53.7 + 127.2
Performance of the Subsidiary Companies (continued)
SIA Cargo
2015/16
$ million
2014/15
$ million % Change
Total revenue 2,045.0 2,240.8 – 8.7
Total expenditure 2,094.7 2,262.8 – 7.4
Operating loss (49.7) (22.0) – 125.9
Exceptional items –(83.3) n.m.
Profit/(Loss) after taxation 90.3 (99.7) n.m.
Singapore Airlines58
PERFORMANCE