Sharp 2006 Annual Report Download - page 8
Download and view the complete annual report
Please find page 8 of the 2006 Sharp annual report below. You can navigate through the pages in the report by either clicking on the pages listed below, or by using the keyword search tool below to find specific information within the annual report.-
 1
1 -
 2
2 -
 3
3 -
 4
4 -
 5
5 -
 6
6 -
 7
7 -
 8
8 -
 9
9 -
 10
10 -
 11
11 -
 12
12 -
 13
13 -
 14
14 -
 15
15 -
 16
16 -
 17
17 -
 18
18 -
 19
19 -
20
-
21
-
22
-
23
-
24
-
25
-
26
-
27
-
28
-
29
-
30
-
31
-
32
-
33
-
34
-
35
-
36
-
37
-
38
-
39
-
40
-
41
-
42
-
43
-
44
-
45
-
46
-
47
-
48
-
49
-
50
-
51
-
52
-
53
-
54
-
55
-
56
-
57
-
58
 |
 |

07
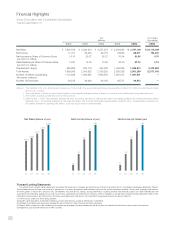
Yen
(millions)
U.S. Dollars
(thousands)
(Notes) 1. The translation into U.S. dollar figures is based on ¥116=U.S.$1, the approximate exchange rate prevailing on March 31, 2006. All dollar figures herein
refer to U.S. currency.
2. The computation of net income per share is based on the weighted average number of shares of common stock outstanding during each fiscal year.
3. The number of shares outstanding is net of treasury stock.
4. Effective April 1, 2002, the Company adopted the new accounting standard for earnings per share and related guidance (Accounting Standards Board
Statement No.2, “Accounting Standard for Earnings Per Share” and Financial Standards Implementation Guidance No.4, “Implementation Guidance for
Accounting Standard for Earnings Per Share”), prior year figures have not been restated.
200620062005200420032002
Net Sales
Net Income
Net Income per Share of Common Stock
(yen and U.S. dollars)
Cash Dividends per Share of Common Stock
(yen and U.S. dollars)
Shareholders’ Equity
Total Assets
Number of Shares Outstanding
(thousands of shares)
Number of Employees
$ 24,113,009
764,405
0.70
0.19
9,473,362
22,071,543
—
—
¥ 2,797,109
88,671
80.85
22.00
1,098,910
2,560,299
1,090,901
46,872
¥ 2,539,859
76,845
70.04
20.00
1,004,326
2,385,026
1,091,075
46,751
¥ 2,257,273
60,715
55.37
18.00
943,532
2,150,250
1,090,672
46,164
¥ 2,003,210
32,594
29.37
15.00
902,116
2,004,832
1,089,855
46,633
¥ 1,803,798
11,311
10.10
14.00
926,856
1,966,909
1,110,598
46,518
Net Sales (billions of yen) Net Income (billions of yen) Net Income per Share (yen)
Financial Highlights
Sharp Corporation and Consolidated Subsidiaries
Years Ended March 31
Forward-Looking Statements
This annual report contains certain statements describing the future plans, strategies and performance of Sharp Corporation and its consolidated subsidiaries (hereinafter “Sharp”).
These statements are not based on historical or present fact, but rather assumptions and estimates based on the current information available. These plans, strategies and perform-
ance are subject to known and unknown risks, uncertainties and other factors. Sharp’s actual performance, business activities and financial position may differ materially from the
assumptions and estimates supplied on account of such risks, uncertainties and other factors. Sharp is under no obligation to update these forward-looking statements in light of new
information, future events or any other factors. The risks, uncertainties and other factors that could affect actual results include, but are not limited to:
(1) The economic situation in which Sharp operates
(2) Sudden, rapid fluctuations in demand for Sharp’s products and services, as well as intense price competition
(3) Changes in exchange rates (particularly between the yen and the U.S. dollar, the euro and other currencies)
(4) Sharp’s ability to respond to rapid technological changes and changing consumer preferences with timely and cost-effective introductions of new products and services
(5) Regulations such as trade restrictions in other countries