Sharp 2006 Annual Report Download - page 32
Download and view the complete annual report
Please find page 32 of the 2006 Sharp annual report below. You can navigate through the pages in the report by either clicking on the pages listed below, or by using the keyword search tool below to find specific information within the annual report.-
 1
1 -
2
-
3
-
4
-
5
-
6
-
7
-
8
-
9
-
10
-
11
-
12
-
13
-
14
-
15
-
16
-
17
-
18
-
19
-
20
-
21
-
 22
22 -
 23
23 -
 24
24 -
 25
25 -
 26
26 -
 27
27 -
 28
28 -
 29
29 -
 30
30 -
 31
31 -
 32
32 -
 33
33 -
 34
34 -
 35
35 -
 36
36 -
 37
37 -
 38
38 -
 39
39 -
 40
40 -
 41
41 -
 42
42 -
43
-
44
-
45
-
46
-
47
-
48
-
49
-
50
-
51
-
52
-
53
-
54
-
55
-
56
-
57
-
58
 |
 |

31
02 03 04 0605
73
121
0
30
60
90
120
150
180
151
163
99
0
2
6
4
8
10
12
0
25
50
75
100
02 03 04 0605
0
2
4
6
8
76
88
32
60
11
02 03 04 0605
1,340
1,509
1,713
1,959
0
500
1,000
1,500
2,000
2,500
65
70
75
80
85
90
2,165
02 03 04 0605
389
422
0
100
200
300
400
500
429
468
393
0
10
20
30
40
50
for LCD panels for TVs expanded. In small- and medium-size LCDs,
sales of proprietary products such as System LCDs increased, espe-
cially those applicable to mobile phones and game consoles. Sales
in this group increased by 16.5% to ¥633,493 million.
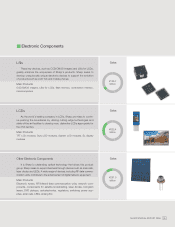
●Other Electronic Components
Sales of solar cells rose as demand for photovoltaic power gen-
eration systems continued to grow for both residential- and indus-
trial-use. Though market price erosion led to year-on-year sales
decline in certain other electronic components, overall sales in this
group increased by 10.8% to ¥291,099 million.
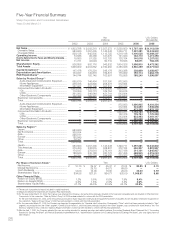
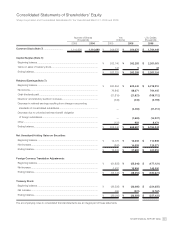
Financial Results
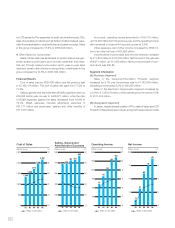
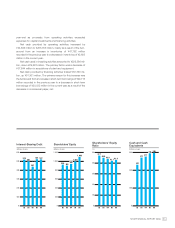
Cost of sales rose by ¥205,468 million over the previous year
to ¥2,165,126 million. The cost of sales ratio grew from 77.2% to
77.4%.
Selling, general and administrative (SG&A) expenses were up
¥39,092 million year-on-year to ¥468,273 million, while the ratio
of SG&A expenses against net sales decreased from 16.9% to
16.7%. SG&A expenses included advertising expenses of
¥51,317 million and employees’ salaries and other benefits of
¥117,678 million.
As a result, operating income amounted to ¥163,710 million,
up ¥12,690 million from the previous year, and the operating income
ratio remained on a par with the previous year at 5.9%.
Other expenses, net of other income, increased by ¥856 mil-
lion to an other net loss of ¥23,692 million.
Income before income taxes and minority interests increased
by ¥11,834 million to ¥140,018 million. Net income for the year was
¥88,671 million, up ¥11,826 million. Net income per share of com-
mon stock was ¥80.85.
Segment Information
[By Business Segment]
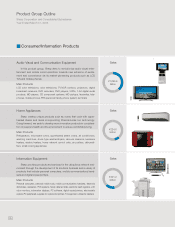
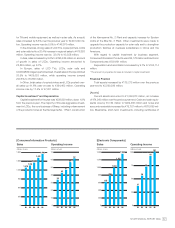
Sales in the Consumer/Information Products segment
increased by 8.1% over the previous year to ¥1,742,849 million.
Operating income grew 9.2% to ¥62,299 million.
Sales in the Electronic Components segment increased by
13.4% to ¥1,358,070 million, while operating income rose by 9.0%
to ¥101,914 million.
[By Geographic Segment]
In Japan, despite slumping sales of PCs, sales of large-size LCD
TVs and mobile phones were robust, and growth was posted in LCDs
Operating Income Net IncomeCost of Sales Selling, General and
Administrative Expenses
Ratio to net sales
Ratio to net salesRatio to net salesRatio to net sales
(billions of yen) (%) (billions of yen) (%) (billions of yen) (%) (billions of yen) (%)