Royal Caribbean Cruise Lines 2004 Annual Report Download - page 14
Download and view the complete annual report
Please find page 14 of the 2004 Royal Caribbean Cruise Lines annual report below. You can navigate through the pages in the report by either clicking on the pages listed below, or by using the keyword search tool below to find specific information within the annual report.-
 1
1 -
2
-
3
-
 4
4 -
 5
5 -
 6
6 -
 7
7 -
 8
8 -
 9
9 -
 10
10 -
 11
11 -
 12
12 -
 13
13 -
 14
14 -
 15
15 -
 16
16 -
 17
17 -
 18
18 -
 19
19 -
 20
20 -
 21
21 -
 22
22 -
 23
23 -
 24
24 -
25
-
26
-
27
-
28
-
29
-
30
-
31
-
32
-
33
-
34
-
35
 |
 |

Other items affecting 2005 include the following:
•In December 2004, the Financial Accounting Standards
Board (“FASB”) issued Statement of Financial Accounting
Standards No. 123 (revised 2004), “Share-Based Payment,”
(“SFAS 123R”). SFAS 123R requires the measurement and
recognition of compensation expense at the fair value of
employee stock awards, except for employee share purchase
plans if they meet certain conditions. We expect this change
to reduce diluted earnings per share by approximately $0.02.
•
Enchantment of the Seas
is scheduled to undergo a length-
ening in the spring of 2005 with a new 73-foot midsection. In
connection with this project, the ship will be out of service
from May until early July 2005. In addition to lost revenue
associated with a decrease in APCD, we expect expenses
associated with this project to reduce diluted earnings per
share by approximately $0.04.
Including the revised assumption for fuel and our expectations
concerning other items set forth above, we now expect diluted
earnings per share for the first quarter of 2005 to be in the
range of $0.55 to $0.60. Notwithstanding the revised assump-
tion for fuel, our expectation for full year 2005 diluted earnings
per share remains unchanged in the range of $2.70 to $2.90.
YEAR ENDED DECEMBER 31, 2004 COMPARED TO
YEAR ENDED DECEMBER 31, 2003
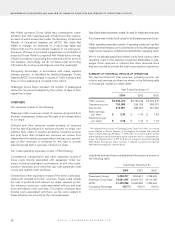
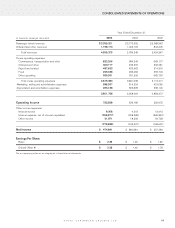
REVENUES
Gross Yields and Net Yields were calculated as follows (in
thousands, except APCD and Yields):
Year Ended December 31,
2004 2003
Passenger ticket revenues $ 3,359,201 $ 2,775,055
Onboard and other revenues 1,196,174 1,009,194
Total revenues 4,555,375 3,784,249
Less:
Commissions, transportation
and other ,822,206 684,344
Onboard and other ,300,717 249,537
Net revenues $ 3,432,452 $ 2,850,368
APCD 21,439,288 19,439,238
Gross Yields $212.48 $194.67
Net Yields $160.10 $146.63
Net revenues increased 20.4% in 2004 compared to 2003. The
increase was due to a 10.3% increase in capacity and a 9.2%
increase in Net Yields. The increase in capacity was primarily
associated with the full year effect of the additions of
Serenade
of the Seas
and
Mariner of the Seas
in 2003 and delivery of
Jewel of the Seas
in 2004. The increase in capacity was par-
tially offset by the cancellation of 54 days of sailings in 2004
due to hurricanes and unscheduled drydocks. The increase in
Net Yields was primarily due to higher cruise ticket prices,
occupancy levels and amounts spent per passenger onboard.
These increases were primarily attributable to improved con-
sumer sentiment towards leisure travel. In 2003, we experi-
enced lower cruise ticket prices due to consumer apprehen-
sion towards travel prior to and during the war in Iraq and eco-
nomic uncertainty. Occupancy in 2004 was 105.7% compared
to 103.2% in 2003. Gross Yields increased 9.1% in 2004 com-
pared to 2003 primarily due to the same reasons discussed
above for Net Yields.
Onboard and other revenues included concession revenues of
$196.3 million and $163.0 million in 2004 and 2003, respec-
tively,which increased in 2004 primarily due to the same rea-
sons discussed above for net revenues.
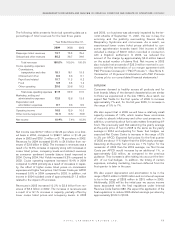
EXPENSES
Gross Cruise Costs and Net Cruise Costs were calculated as
follows (in thousands, except APCD and costs per APCD):
Year Ended December 31,
2004 2003
Total cruise operating expenses $ 2,819,383 $ 2,381,035
Marketing, selling and
administrative expenses ,588,267 514,334
Gross Cruise Costs 3,407,650 2,895,369
Less:
Commissions, transportation
and other ,822,206 684,344
Onboard and other ,300,717 249,537
Net Cruise Costs $ 2,284,727 $ 1,961,488
APCD 21,439,288 19,439,238
Gross Cruise Costs per APCD $158.94 $148.94
Net Cruise Costs per APCD $106.57 $100.90
ROYAL CARIBBEAN CRUISES LTD.
12
MANAGEMENT’S DISCUSSION AND ANALYSIS OF FINANCIAL CONDITION AND RESULTS OF OPERATIONS (CONTINUED)