Royal Caribbean Cruise Lines 2004 Annual Report Download - page 12
Download and view the complete annual report
Please find page 12 of the 2004 Royal Caribbean Cruise Lines annual report below. You can navigate through the pages in the report by either clicking on the pages listed below, or by using the keyword search tool below to find specific information within the annual report.-
 1
1 -
 2
2 -
 3
3 -
 4
4 -
 5
5 -
 6
6 -
 7
7 -
 8
8 -
 9
9 -
 10
10 -
 11
11 -
 12
12 -
 13
13 -
 14
14 -
 15
15 -
 16
16 -
 17
17 -
 18
18 -
 19
19 -
 20
20 -
 21
21 -
 22
22 -
23
-
24
-
25
-
26
-
27
-
28
-
29
-
30
-
31
-
32
-
33
-
34
-
35
 |
 |

Net Yields represent Gross Yields less commissions, trans-
portation and other expenses and onboard and other expens-
es (each of which is described under the
Summary of Historical
Results of Operations
heading) per APCD. We utilize Net
Yields to manage our business on a day-to-day basis and
believe that it is the most relevant measure of our pricing per-
formance. We have not provided a quantitative reconciliation of
projected Gross Yields to projected Net Yields due to the sig-
nificant uncertainty in projecting the costs deducted to arrive at
this measure. Accordingly, we do not believe that reconciling
information for such projected figures would be meaningful.
Occupancy Percentage, in accordance with cruise vacation
industry practice, is calculated by dividing Passenger Cruise
Days by APCD. A percentage in excess of 100% indicates that
three or more passengers occupied some cabins.
Passenger Cruise Days represent the number of passengers
carried for the period multiplied by the number of days of their
respective cruises.
OVERVIEW
Our revenues consist of the following:
Passenger ticket revenues consist of revenue recognized from
the sale of passenger tickets and the sale of air transportation
to our ships.
Onboard and other revenues consist primarily of revenues
from the sale of goods and/or services onboard our ships, can-
cellation fees, sales of vacation protection insurance and pre
and post tours. Also included are revenues we receive from
independent third party concessionaires that pay us a percent-
age of their revenues in exchange for the right to provide
selected goods and/or services onboard our ships.
Our cruise operating expenses consist of the following:
Commissions, transportation and other expenses consist of
those costs directly associated with passenger ticket rev-
enues, including travel agent commissions, air and other trans-
portation expenses, port costs that vary with passenger head
counts and related credit cardfees.
Onboardand other expenses consist of the direct costs asso-
ciated with onboard and other revenues. These costs include
the cost of products sold onboard our ships, vacation protec-
tion insurance premiums, costs associated with preand post
tours and related credit cardfees. Concession revenues have
minimal costs associated with them, as the costs related to
these activities are incurred by the concessionaires.
Payroll and related expenses consist of costs for shipboard personnel.
Food expenses include food costs for both passengers and crew.
Other operating expenses consist of operating costs such as fuel,
repairs and maintenance, port costs that do not vary with passenger
head counts, insurance, entertainment and all other operating costs.
We do not allocate payroll and related costs, food costs or other
operating costs to the expense categories attributable to pas-
senger ticket revenues or onboard and other revenues since
they are incurred to provide the total cruise vacation experience.
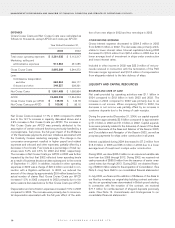
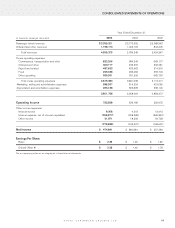
SUMMARY OF HISTORICAL RESULTS OF OPERATIONS
We reported historical total revenues, operating income, net
income and earnings per share as shown in the following table
(in thousands, except per share data):
Year Ended December 31,
2004 2003 2002
Total revenues $4,555,375 $3,784,249 $ 3,434,347
Operating income 753,589 526,185 550,975
Net income 474,691 280,664 351,284
Basic earnings
per share $ 2.39 $ 1.45 $ 1.82
Diluted earnings
per share1$ 2.26 $ 1.42 $ 1.76
1We adopted the provisions of Emerging Issues Task Force 04-8 “Accounting
Issues Related to Certain Features of Contingently Convertible Debt and the
Effect on Diluted Earnings Per Share,” (“EITF 04-8”) in our fourth quarter of 2004
and restated prior period diluted earnings per share amounts for comparative pur-
poses. The implementation of EITF 04-8 did not change our previously reported
2003 diluted earnings per share; however, it reduced our previously reported
2002 diluted earnings per shareby $0.03.
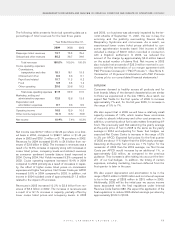
Unaudited selected historical statistical information is shown in
the following table:
Year Ended December 31,
2004 2003 2002
Passengers Carried 3,405,227 2,990,607 2,768,475
Passenger Cruise Days 22,661,965 20,064,702 18,112,782
APCD 21,439,288 19,439,238 17,334,204
Occupancy Percentage 105.7% 103.2% 104.5%
ROYAL CARIBBEAN CRUISES LTD.
10
MANAGEMENT’S DISCUSSION AND ANALYSIS OF FINANCIAL CONDITION AND RESULTS OF OPERATIONS (CONTINUED)