Ross 2008 Annual Report Download - page 4
Download and view the complete annual report
Please find page 4 of the 2008 Ross annual report below. You can navigate through the pages in the report by either clicking on the pages listed below, or by using the keyword search tool below to find specific information within the annual report.-
 1
1 -
 2
2 -
 3
3 -
 4
4 -
 5
5 -
 6
6 -
 7
7 -
 8
8 -
 9
9 -
 10
10 -
 11
11 -
 12
12 -
 13
13 -
 14
14 -
 15
15 -
16
-
17
-
18
-
19
-
20
-
21
-
22
-
23
-
24
-
25
-
26
-
27
-
28
-
29
-
30
-
31
-
32
-
33
-
34
-
35
-
36
-
37
-
38
-
39
-
40
-
41
-
42
-
43
-
44
-
45
-
46
-
47
-
48
-
49
-
50
-
51
-
52
-
53
-
54
-
55
-
56
-
57
-
58
-
59
-
60
-
61
-
62
-
63
-
64
-
65
-
66
-
67
-
68
-
69
-
70
-
71
-
72
-
73
-
74
 |
 |

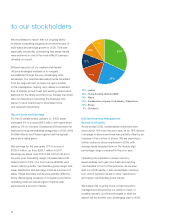
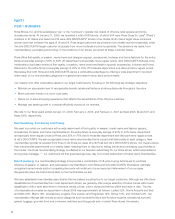
We are pleased to report that our ongoing ability
to deliver compelling bargains drove another year of
solid sales and earnings growth in 2008. This was
especially noteworthy considering that these results
were achieved in one of the most difficult business
climates on record.
Efficient execution of our resilient and flexible
off-price strategies enabled us to navigate
successfully through the very challenging retail
landscape. Our merchandise assortments benefited
from the huge amount of close-out opportunities
in the marketplace, helping us to deliver a consistent
flow of sharply-priced, fresh and exciting name-brand
fashions for the family and the home. Equally important
was our discipline in operating the business with
leaner in-store inventories to drive faster turns
and reduced markdowns.
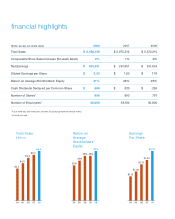
Record Sales and Earnings
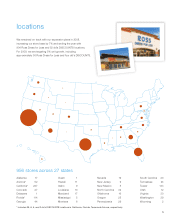
For the 52 weeks ended January 31, 2009, sales
increased 9% to a record $6.5 billion, with same store
sales up 2% for the year. Dresses and Shoes were the
best performing merchandise categories in 2008, while
the Mid-Atlantic and Texas regions had the highest
same store sales gains.
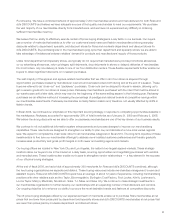
Net earnings for the year grew 17% to a record
$305.4 million, up from $261.1 million in 2007.
Earnings per share rose 23% to $2.33 from $1.90 in
the prior year. Operating margin increased about 60
basis points to 7.6%. Our improved profitability was
driven mainly by better merchandise gross margin and
lower distribution and shortage costs as a percent of
sales. These favorable trends were partially offset by
some deleveraging pressure on occupancy and store
operating costs as well as higher incentive plan
expenses as a percent of sales.
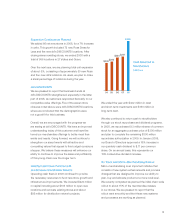
Efficient Inventory Management
Boosts Profitability
As we ended 2008, consolidated inventories were
down about 14% from the prior year, as an 18% decline
in average in-store inventories was partially offset by an
increase in the number of stores. We are planning to
further reduce in-store inventories in 2009, with
average levels targeted down in the double digit
percentage range compared to the prior year.
Operating the business on lower inventory
levels enables us to get more fresh and exciting
merchandise in front of the customer. As we saw
with our 2008 results, it also drives faster inventory
turn, which typically results in lower markdowns
and higher merchandise gross margin.
We believe this ongoing focus on tight inventory
management will enhance our ability to meet, or
possibly exceed, our financial targets in what we
expect will be another very challenging year in 2009.
2
to our stockholders
32% Ladies
23% Home Accents, Bed and Bath
14% Men’s
12% Accessories, Lingerie, Fine Jewelry, Fragrances
10% Shoes
9% Children’s
32%
23%
9%
10%
12%
14%