Ross 2008 Annual Report Download - page 21
Download and view the complete annual report
Please find page 21 of the 2008 Ross annual report below. You can navigate through the pages in the report by either clicking on the pages listed below, or by using the keyword search tool below to find specific information within the annual report.-
 1
1 -
2
-
3
-
4
-
5
-
6
-
7
-
8
-
9
-
10
-
 11
11 -
 12
12 -
 13
13 -
 14
14 -
 15
15 -
 16
16 -
 17
17 -
 18
18 -
 19
19 -
 20
20 -
 21
21 -
 22
22 -
 23
23 -
 24
24 -
 25
25 -
 26
26 -
 27
27 -
 28
28 -
 29
29 -
 30
30 -
 31
31 -
32
-
33
-
34
-
35
-
36
-
37
-
38
-
39
-
40
-
41
-
42
-
43
-
44
-
45
-
46
-
47
-
48
-
49
-
50
-
51
-
52
-
53
-
54
-
55
-
56
-
57
-
58
-
59
-
60
-
61
-
62
-
63
-
64
-
65
-
66
-
67
-
68
-
69
-
70
-
71
-
72
-
73
-
74
 |
 |

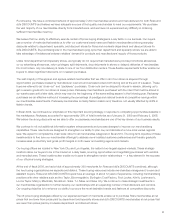
19
COMPARISON OF 5 YEAR CUMULATIVE TOTAL RETURN*
Among Ross Stores, Inc., The S&P 500 Index
And S&P Retailing Group
* $100 invested on 1/30/04 in stock or index, including reinvestment of dividends. Fiscal year ending January 31.
Indexes calculated on month-end basis.
Indexed Returns for Years Ending
Base Period
Company / Index 2004 2005 2006 2007 2008 2009
Ross Stores, Inc. 100 101 107 120 111 110
S&P 500 Index 100 106 117 134 131 81
S&P Retailing Group 100 117 128 145 123 77
$ 0
$ 20
$ 40
$ 60
$ 80
$100
$120
$140
$160
1/04 1/05 1/06 2/07 2/08 1/09
Ross Stores, Inc. S&P 500 Index S&P Retailing Group