Prudential 2015 Annual Report Download - page 9
Download and view the complete annual report
Please find page 9 of the 2015 Prudential annual report below. You can navigate through the pages in the report by either clicking on the pages listed below, or by using the keyword search tool below to find specific information within the annual report.-
 1
1 -
 2
2 -
 3
3 -
 4
4 -
 5
5 -
 6
6 -
 7
7 -
 8
8 -
 9
9 -
 10
10 -
 11
11 -
 12
12 -
 13
13 -
 14
14 -
 15
15 -
 16
16 -
 17
17 -
 18
18 -
 19
19 -
 20
20 -
21
-
22
-
23
-
24
-
25
-
26
-
27
-
28
-
29
-
30
-
31
-
32
-
33
-
34
-
35
-
36
-
37
-
38
-
39
-
40
-
41
-
42
-
43
-
44
-
45
-
46
-
47
-
48
-
49
-
50
-
51
-
52
-
53
-
54
-
55
-
56
-
57
-
58
-
59
-
60
-
61
-
62
-
63
-
64
-
65
-
66
-
67
-
68
-
69
-
70
-
71
-
72
-
73
-
74
-
75
-
76
-
77
-
78
-
79
-
80
-
81
-
82
-
83
-
84
-
85
-
86
-
87
-
88
-
89
-
90
-
91
-
92
-
93
-
94
-
95
-
96
-
97
-
98
-
99
-
100
-
101
-
102
-
103
-
104
-
105
-
106
-
107
-
108
-
109
-
110
-
111
-
112
-
113
-
114
-
115
-
116
-
117
-
118
-
119
-
120
-
121
-
122
-
123
-
124
-
125
-
126
-
127
-
128
-
129
-
130
-
131
-
132
-
133
-
134
-
135
-
136
-
137
-
138
-
139
-
140
-
141
-
142
-
143
-
144
-
145
-
146
-
147
-
148
-
149
-
150
-
151
-
152
-
153
-
154
-
155
-
156
-
157
-
158
-
159
-
160
-
161
-
162
-
163
-
164
-
165
-
166
-
167
-
168
-
169
-
170
-
171
-
172
-
173
-
174
-
175
-
176
-
177
-
178
-
179
-
180
-
181
-
182
-
183
-
184
-
185
-
186
-
187
-
188
-
189
-
190
-
191
-
192
-
193
-
194
-
195
-
196
-
197
-
198
-
199
-
200
-
201
-
202
-
203
-
204
-
205
-
206
-
207
-
208
-
209
-
210
-
211
-
212
-
213
-
214
-
215
-
216
-
217
-
218
-
219
-
220
-
221
-
222
-
223
-
224
-
225
-
226
-
227
-
228
-
229
-
230
-
231
-
232
 |
 |

Prudential Financial, Inc. 2015 Annual Report 7
(A) Adjusted operating income is a non-GAAP measure of
performance that excludes “Realized investment gains (losses),
net,” as adjusted, and related charges and adjustments; net
investment gains and losses on trading account assets supporting
insurance liabilities; change in experience-rated contractholder
liabilities due to asset value changes; results of divested businesses
and discontinued operations; earnings attributable to noncontrolling
interests; and the related tax effects thereof. Adjusted operating
income includes equity in earnings of operating joint ventures and
the related tax effects thereof. Revenues and benefits and expenses
shown as components of adjusted operating income, are presented
on the same basis as pre-tax adjusted operating income and are
adjusted for the items above as well.
See Management’s Discussion and Analysis of Financial Condition
and Results of Operations for a discussion of results based on
adjusted operating income and the Consolidated Financial
Statements for a reconciliation of results based on adjusted
operating income to GAAP results.
(B) Represents results of the Financial Services Businesses for the
twelve months ended December 31, 2014 and 2013, and attributed
equity of the Financial Services Businesses as of those dates.
(C) Operating return on average equity is calculated by dividing
adjusted operating income after-tax (giving effect to the direct
equity adjustment for earnings per share calculation for periods
prior to 2015), by average attributed equity excluding accumulated
other comprehensive income and adjusted to remove amount
included for foreign currency exchange rate remeasurement.
An alternative measure to operating return on average equity
(based on adjusted operating income) is return on average equity
(based on income from continuing operations). For the year ended
December 31, 2015, return on average equity (based on income
from continuing operations) is calculated by dividing consolidated
income from continuing operations after-tax attributable to
Prudential Financial, Inc., by average total attributed equity. For the
years ended December 31, 2014 and 2013, return on average equity
is calculated by dividing income from continuing operations after-
tax for the Financial Services Businesses attributable to Prudential
Financial, Inc. (giving effect to the direct equity adjustment for
earnings per share calculation), by average total attributed equity
for the Financial Services Businesses.
(D) From December 18, 2001, the date of demutualization, through
December 31, 2014, the Company had two separate classes of
common stock. The Common Stock reflected the performance of
the Financial Services Businesses and the Class B Stock reflected
the performance of the Closed Block Business. Earnings per share
were calculated separately for each of these two classes of common
stock and included a direct equity adjustment to modify the earnings
available to each of the classes of common stock for the difference
between the allocation of general and administrative expenses to
each of the businesses and the cash flows between the businesses
related to these expenses. Accordingly, earnings per share of Common
Stock for periods through December 31, 2014, reflect earnings
attributable to the Financial Services Businesses. On January 2,
2015, Prudential Financial, Inc., repurchased and cancelled all of
the 2.0 million shares of the Class B Stock. Accordingly, earnings
per share of Common Stock for periods subsequent to December 31,
2014, reflect the consolidated earnings of Prudential Financial, Inc.
In addition, the Class B Repurchase resulted in the elimination of
the separation of the Financial Services Businesses and the Closed
Block Business. As a result, there is no direct equity adjustment
recorded for periods subsequent to December 31, 2014. Earnings
per share of the Class B Stock for periods through December 31,
2014, are not presented herein, as they are not meaningful due to
the Class B Repurchase.
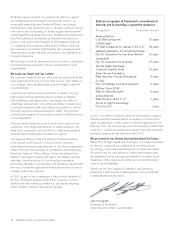
Adjusted operating income
Income (loss) from continuing operations
before income taxes and equity in earnings
of operating joint ventures (GAAP)
Adjusted operating revenues
Revenues (GAAP)
Adjusted Operating Income(A)(B)
and Income (Loss) from
Continuing Operations(B)
(pre-tax, in millions)
Assets Under Management
(in billions)
Operating Return on
Average Equity(B)(C) and
Return on Average Equity(B)(C)
Adjusted Operating Revenues(A)(B)
and GAAP Revenues(B)
(in billions)
$
(2,000)
$
(1
,
000)
$0
$
1
,
000
$
2
,
000
$
3
,
000
$4
,
000
$
5,000
$
6,000
$
7,000
$
8,000
2
015
2013
2
014
2
015
2013
201
4
$2
0
$
4
0
$
6
0
$0
2
0
1
3
2
0
14 201
5
$
0
$
250
$
500
$
750
$
1
,
00
0
$
1
,
25
0
0%
5.0%
1
0.0
%
1
5.
0%
20.0
%
20
14
20
1
5
-
5
%
2013
Operating return on average equity
Return on average equity