Prudential 2002 Annual Report Download - page 7
Download and view the complete annual report
Please find page 7 of the 2002 Prudential annual report below. You can navigate through the pages in the report by either clicking on the pages listed below, or by using the keyword search tool below to find specific information within the annual report.-
 1
1 -
 2
2 -
 3
3 -
 4
4 -
 5
5 -
 6
6 -
 7
7 -
 8
8 -
 9
9 -
 10
10 -
 11
11 -
 12
12 -
 13
13 -
 14
14 -
 15
15 -
 16
16 -
 17
17 -
 18
18 -
19
-
20
-
21
-
22
-
23
-
24
-
25
-
26
-
27
-
28
-
29
-
30
-
31
-
32
-
33
-
34
-
35
-
36
-
37
-
38
-
39
-
40
-
41
-
42
-
43
-
44
-
45
-
46
-
47
-
48
-
49
-
50
-
51
-
52
-
53
-
54
-
55
-
56
-
57
-
58
-
59
-
60
-
61
-
62
-
63
-
64
-
65
-
66
-
67
-
68
-
69
-
70
-
71
-
72
-
73
-
74
-
75
-
76
-
77
-
78
-
79
-
80
-
81
-
82
-
83
-
84
-
85
-
86
-
87
-
88
-
89
-
90
-
91
-
92
-
93
-
94
-
95
-
96
-
97
-
98
-
99
-
100
-
101
-
102
-
103
-
104
-
105
-
106
-
107
-
108
-
109
-
110
-
111
-
112
-
113
-
114
-
115
-
116
-
117
-
118
-
119
-
120
-
121
-
122
-
123
-
124
-
125
-
126
-
127
-
128
-
129
-
130
-
131
-
132
-
133
-
134
-
135
-
136
-
137
-
138
-
139
-
140
-
141
-
142
-
143
-
144
-
145
-
146
-
147
-
148
-
149
-
150
-
151
-
152
-
153
-
154
-
155
-
156
-
157
-
158
-
159
-
160
-
161
-
162
 |
 |

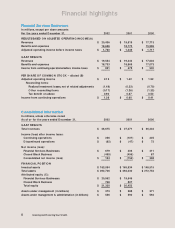
(A) Adjusted operating
income is a non-GAAP
measure, which excludes
realized investment gains,
net of losses and related
adjustments; sales practices
remedies and costs; demu-
tualization costs and
expenses; and results of
divested businesses and
discontinued operations.
Revenues and benefits and
expenses presented as
components of adjusted
operating income exclude
these items as well. See
Management’s D iscussion
and Analysis of Financial
Condition and Results of
O perations for further
discussion of adjusted
operating results and the
Consolidated Financial
Statements for a reconcili-
ation of results based on
adjusted operating income
to GAAP results.
(B) Per share of Common
Stock information reflects
results attributable to the
Financial Services
Businesses. For the
2001 and 2000 periods,
earnings per share are
presented on an equivalent
share basis whereby shares
of Common Stock issued
in the demutualization
were assumed to be
outstanding for the
entire period, and earnings
were not adjusted for
demutualization or
related transactions,
including establishment
of the Financial Services
Businesses and Closed
Block Business.
(C) The Financial Services
Businesses and Closed
Block Business were
established in connection
with demutualization. As a
result, attributed equity
for periods prior to
demutualization is not
presented.
$2,000—
$1,500—
$1,000—
$500—
Prudential Financial 2002 Annual Report 5
$400—
$300—
$200—
$100—
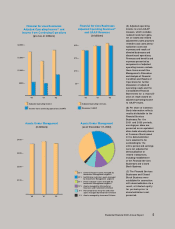
Assets Under Management
(in billions)
’00 ’01 ’02
’00 ’01 ’02
’00 ’01 ’02
Adjusted operating income
Income from continuing operations (GAAP)
Adjusted operating revenues
Revenues (GAAP)
Financial Services Businesses
Adjusted O perating Income(A) and
Income from Continuing O perations
(pre-tax, in millions)
Financial Services Businesses
Adjusted O perating Revenues(A)
and GAAP Revenues
(in billions)
Assets Under Management
(as of D ecember 31, 2002)
33% General Account assets managed by
Investment Management segment
23% Institutional customer assets managed
by Investment Management segment
21% Retail customer assets managed by
Investment Management segment
12% Assets managed by International
Insurance and Investments D ivision
9% N on-proprietar y wrap-fee and other
assets managed by Investment D ivision
2% Assets managed by Insurance D ivision
$20—
$15—
$10—
$5—