Prudential 2002 Annual Report Download - page 6
Download and view the complete annual report
Please find page 6 of the 2002 Prudential annual report below. You can navigate through the pages in the report by either clicking on the pages listed below, or by using the keyword search tool below to find specific information within the annual report.-
 1
1 -
 2
2 -
 3
3 -
 4
4 -
 5
5 -
 6
6 -
 7
7 -
 8
8 -
 9
9 -
 10
10 -
 11
11 -
 12
12 -
 13
13 -
 14
14 -
 15
15 -
 16
16 -
 17
17 -
18
-
19
-
20
-
21
-
22
-
23
-
24
-
25
-
26
-
27
-
28
-
29
-
30
-
31
-
32
-
33
-
34
-
35
-
36
-
37
-
38
-
39
-
40
-
41
-
42
-
43
-
44
-
45
-
46
-
47
-
48
-
49
-
50
-
51
-
52
-
53
-
54
-
55
-
56
-
57
-
58
-
59
-
60
-
61
-
62
-
63
-
64
-
65
-
66
-
67
-
68
-
69
-
70
-
71
-
72
-
73
-
74
-
75
-
76
-
77
-
78
-
79
-
80
-
81
-
82
-
83
-
84
-
85
-
86
-
87
-
88
-
89
-
90
-
91
-
92
-
93
-
94
-
95
-
96
-
97
-
98
-
99
-
100
-
101
-
102
-
103
-
104
-
105
-
106
-
107
-
108
-
109
-
110
-
111
-
112
-
113
-
114
-
115
-
116
-
117
-
118
-
119
-
120
-
121
-
122
-
123
-
124
-
125
-
126
-
127
-
128
-
129
-
130
-
131
-
132
-
133
-
134
-
135
-
136
-
137
-
138
-
139
-
140
-
141
-
142
-
143
-
144
-
145
-
146
-
147
-
148
-
149
-
150
-
151
-
152
-
153
-
154
-
155
-
156
-
157
-
158
-
159
-
160
-
161
-
162
 |
 |

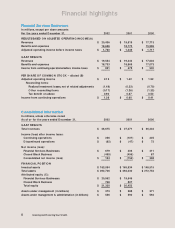
Financial Services Businesses
In millions, except per share amounts
For the years ended D ecember 31, 2002 2001 2000
RESULTS BASED O N AD JUSTED O PERATIN G IN CO ME (A)
Revenues $ 20,436 $ 19,519 $ 17,713
Benefits and expenses 18,656 18,170 15,996
Adjusted operating income before income taxes $ 1,780 $ 1,349 $ 1,717
GAAP RESULTS
Revenues $ 19,554 $ 19,343 $ 17,603
Benefits and expenses 18,733 18,865 17,073
Income from continuing operations before income taxes $ 821 $ 478 $ 530
PER SH ARE O F CO MMO N STO CK – diluted (B)
Adjusted operating income $ 2.12 $ 1.42 $ 1.92
Reconciling items:
Realized investment losses, net of related adjustments (1.49) (0.23) (0.70)
O ther reconciling items (0.17) (1.26) (1.33)
Tax benefit on above 0.90 0.67 0.52
Income from continuing operations $ 1.36 $ 0.60 $ 0.41
Consolidated Information
In millions, unless otherwise noted
As of or for the years ended D ecember 31, 2002 2001 2000
GAAP RESULTS
Total revenues $ 26,675 $ 27,071 $ 26,332
Income (loss) after income taxes:
Continuing operations $ 256 $ (107) $ 325
D iscontinued operations $ (62) $ (47) $ 73
N et income (loss):
Financial Services Businesses $ 679 $ 302 $ 311
Closed Block Business (485) (456) 87
Consolidated net income (loss) $ 194 $ (154) $ 398
FIN AN CIAL PO SITIO N
Invested assets $ 183,094 $ 165,834 $ 148,515
Total assets $ 292,746 $ 293,030 $ 272,753
Attributed equity (C):
Financial Services Businesses $ 20,562 $ 19,646
Closed Block Business 768 807
Total equity $ 21,330 $ 20,453
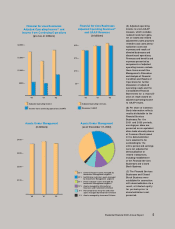
Assets under management (in billions) $ 373 $ 388 $ 371
Assets under management & administration (in billions) $ 556 $ 590 $ 593
4Growing and Protecting Your W ealth
Financial highlights