Plantronics 2003 Annual Report Download - page 11
Download and view the complete annual report
Please find page 11 of the 2003 Plantronics annual report below. You can navigate through the pages in the report by either clicking on the pages listed below, or by using the keyword search tool below to find specific information within the annual report.-
 1
1 -
 2
2 -
 3
3 -
 4
4 -
 5
5 -
 6
6 -
 7
7 -
 8
8 -
 9
9 -
 10
10 -
 11
11 -
 12
12 -
 13
13 -
 14
14 -
 15
15 -
 16
16 -
 17
17 -
 18
18 -
 19
19 -
 20
20 -
 21
21 -
 22
22 -
23
-
24
-
25
-
26
-
27
-
28
-
29
-
30
-
31
-
32
 |
 |

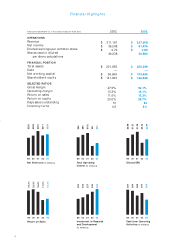
Financial Highlights
OPERATIONS
Revenue
Net income
Diluted earnings per common share
Shares used in diluted
per share calculations
$311,181
$ 36,248
$ 0.74
49,238
FINANCIAL POSITION
Total assets
Debt
Net working capital
Shareholders‘ equity
$201,058
––
$96,669
$141,993
SELECTED RATIOS
Gross margin
Operating margin
Return on sales
Return on equity
Days sales outstanding
Inventory turns
47.5%
13.3%
11.6%
23.0%
51
4.5
Fiscal year ended March 31, in thousands, except per share data
99
$283
Net Revenues (in millions)
2002
$337,508
$ 41,476
$ 0.89
46,584
$ 205,209
––
$103,605
$ 146,930
50.1%
16.1%
12.3%
28.7%
54
5.0
2003
00
$309
01
$391
02
$311
03
$338
99
$84
To tal Operating
Income (in millions)
00
$93
01
$102
02
$41
03
$54
99
$20
Investment in Research
and Development
(in millions)
00
$22
01
$27
02
$30
03
$34
99
$87
Cash from Operating
Activities (in millions)
00
$84
01
$68
02
$77
03
$50
16
99
$0.99
Diluted EPS
00
$1.22
01
$1.38
02
$0.74
03
$0.89
99
19.2%
Return on Sales
00
20.9%
01
18.8%
02
11.6%
03
12.3%