Pepsi 2007 Annual Report Download - page 5
Download and view the complete annual report
Please find page 5 of the 2007 Pepsi annual report below. You can navigate through the pages in the report by either clicking on the pages listed below, or by using the keyword search tool below to find specific information within the annual report.-
 1
1 -
 2
2 -
 3
3 -
 4
4 -
 5
5 -
 6
6 -
 7
7 -
 8
8 -
 9
9 -
 10
10 -
 11
11 -
 12
12 -
 13
13 -
 14
14 -
 15
15 -
 16
16 -
17
-
18
-
19
-
20
-
21
-
22
-
23
-
24
-
25
-
26
-
27
-
28
-
29
-
30
-
31
-
32
-
33
-
34
-
35
-
36
-
37
-
38
-
39
-
40
-
41
-
42
-
43
-
44
-
45
-
46
-
47
-
48
-
49
-
50
-
51
-
52
-
53
-
54
-
55
-
56
-
57
-
58
-
59
-
60
-
61
-
62
-
63
-
64
-
65
-
66
-
67
-
68
-
69
-
70
-
71
-
72
-
73
-
74
-
75
-
76
-
77
-
78
-
79
-
80
-
81
-
82
-
83
-
84
-
85
-
86
-
87
-
88
-
89
-
90
 |
 |

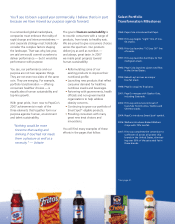
Our brands once again demonstrated competitive strength.
On the ground, in cities and towns around the world, good brand strategies were
implemented with operational excellence. I’d like to share a few notable examples of
the big marketplace wins we enjoyed in 2007:
• Our carbonated soft drink and savory snack brands gained market share in the United
States and in many of our top international markets.
• In the United Kingdom, Baked Walkers crisps was named “New Product of the Year” by
Marketing Week magazine.
• SunChips snacks delivered double-digit growth in the United States as a result of great,
innovative marketing and in-store execution.
• 7UP H2Oh! was our fastest-growing brand in value and volume share in Brazil in
its launch year.
• Pepsi Max came of age as a global brand, with outstanding performance in the United
States as Diet Pepsi Max, after successes in Northern Europe and Australia and 2007
launches across Asia.
• PepsiCo beverage brands crossed the $1 billion mark in Russia retail sales.
• We posted double-digit volume growth in China beverages and high-single-digit
beverage volume growth in India.
And we did all of this while battling increased commodity inflation and more
macroeconomic volatility than in previous years.
In the next few pages you’ll learn a lot more about the performance of our individual
businesses from the leaders of PepsiCo Americas Foods, PepsiCo Americas Beverages and
PepsiCo International.
Earnings Per Share*
$2.66
$3.00
$3.38
2005 2006 2007
*See page 86.
$4,204 $4,065
$4,551
2005 2006 2007
**See page 55.
Management Operating
Cash Flow**
$ in Millions
2007 Scorecard
*See page 86.
12% 10%
4%
Volume Net Revenue Division Operating Profit*
Earnings Per Share* Total Return to
Shareholders
Return on Invested Capital
26%
29%
13%
33