Papa Johns 2014 Annual Report Download - page 5
Download and view the complete annual report
Please find page 5 of the 2014 Papa Johns annual report below. You can navigate through the pages in the report by either clicking on the pages listed below, or by using the keyword search tool below to find specific information within the annual report.-
 1
1 -
 2
2 -
 3
3 -
 4
4 -
 5
5 -
 6
6 -
 7
7 -
 8
8 -
 9
9 -
 10
10 -
 11
11 -
 12
12 -
 13
13 -
 14
14 -
 15
15 -
 16
16 -
17
-
18
-
19
-
20
-
21
-
22
-
23
-
24
-
25
-
26
-
27
-
28
-
29
-
30
-
31
-
32
-
33
-
34
-
35
-
36
-
37
-
38
-
39
-
40
-
41
-
42
-
43
-
44
-
45
-
46
-
47
-
48
-
49
-
50
-
51
-
52
-
53
-
54
-
55
-
56
-
57
-
58
-
59
-
60
-
61
-
62
-
63
-
64
-
65
-
66
-
67
-
68
-
69
-
70
-
71
-
72
-
73
-
74
-
75
-
76
-
77
-
78
-
79
-
80
-
81
-
82
-
83
-
84
-
85
-
86
-
87
-
88
-
89
-
90
-
91
-
92
-
93
-
94
-
95
-
96
-
97
-
98
-
99
-
100
-
101
-
102
-
103
-
104
-
105
-
106
-
107
-
108
-
109
-
110
 |
 |

Better Ingredients. Better Pizza.
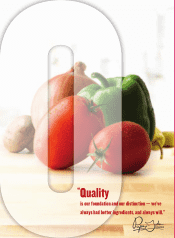
You can’t make good wine from bad grapes. Quality is our
foundation and our distinction—we’ve always had better
ingredients, and we always will. We invest in the best
ingredients for our pizza, starting with our fresh, never-frozen
hand-tossed original dough made with extra virgin olive oil.
Our fresh-packed tomato sauce is just that: packed from ripe,
farm-grown freshly picked California tomatoes, extra virgin
olive oil, salt, sunflower oil, sugar, and spices – we are the
rare brand that refuses to have our pizza sauce
re-manufactured from industrial
tomato paste. You won’t find
fillers in our meats, nor will
you find trans-fats, MSG,
BHA, BHT or partially
hydrogenated oils. This
continued focus on
quality not only delivers
on the promise of “better
ingredients,” but also
ensures we maintain the taste that customers desire, which
creates brand loyalty among our customers, which we love.
But we need to keep striving to deliver the best. As
consumers continue to expect greater transparency from the
food industry through better ingredient choices, we’re looking
closely at our labels to ensure we are keeping up with—and
staying ahead of—food trends without sacrificing the great
taste that customers desire. To find out more information
about what goes into our products and onto our pizzas, go to
www.papajohns.com/better.
Customers continue to respond favorably to our ‘Better
Ingredients. Better Pizza.’ promise. Papa John’s earned the
top spot in the 2014 American Customer Satisfaction Index
(ACSI) earlier this year, when we achieved the highest rating
in the pizza category for an unprecedented 13th time in the
past 15 years – and for 2014 the highest rating across all
limited-service restaurant companies surveyed. Papa John's
also earned the highest score regarding overall quality,
product and service quality and customer expectations in the
individual ACSI ratings.
Our customer loyalty program, Papa Rewards, also was
recognized by the prestigious Bond Brand Loyalty Report,
taking the top spot over other major food service providers’
programs including some other very well-run companies.
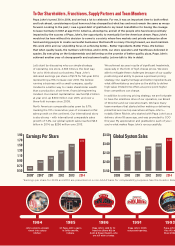
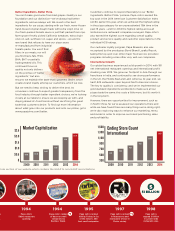
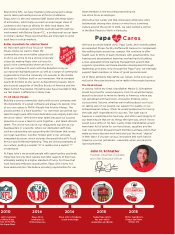
International Growth
Our global business experienced solid growth in 2014, with 181
net international restaurant openings and international profit
doubling over 2013. We grew our footprint in Asia through our
franchisee in India, and continued to see strong performance
in the UK, the Middle East and Latin America. At year end, we
had 1,323 restaurants open beyond North America’s shores.
The key to quality is consistency, and we’ve implemented our
gold standard ingredients worldwide to make sure all our
pizzas taste the same; this costs a little more, but it’s worth it
in the long term.
However, there are opportunities for improvement, such as
in North China. So we’ve assessed our operations there and
while we have found there are many things we’re doing right,
we’re also exploring ways to enhance our marketing, menu
and model in order to improve our brand positioning, sales
and profitability.
2009
300
500
700
900
1,100
1,300
1,500
2010 2011 2012 2013 2014
Ending Store Count
International
635
709
822
959
1,142
1,323
2009
$
$0.5
$1.0
$1.5
$2.5
$2.0
2010 2011 2012 2013 2014
Market Capitalization
$0.6B $0.7B
$0.9B
$1.2B
$1.9B
$2.2B
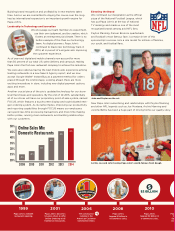
3
apa John’s
files IPO at
e #232.
1994
Papa John’s
500th restaurant
opening.
1995
Papa John’s ranked
10th by Forbes in list
of the nation’s 200
best small companies.
elations section of our website which contains the GAAP to non-GAAP reconciliations.
$1 BILLION
$
1998
Papa John’s
topped $1 billion
in system-wide
restaurant sales.
1994
Papa John’s ranked
of best-run small
companies by
Business Week.
#1
1997
Papa John’s ranked
in Restaurants and
Institutions Choice in
Chains survey.
#1