Papa Johns 2000 Annual Report Download - page 4
Download and view the complete annual report
Please find page 4 of the 2000 Papa Johns annual report below. You can navigate through the pages in the report by either clicking on the pages listed below, or by using the keyword search tool below to find specific information within the annual report.-
 1
1 -
 2
2 -
 3
3 -
 4
4 -
 5
5 -
 6
6 -
 7
7 -
 8
8 -
 9
9 -
 10
10 -
 11
11 -
 12
12 -
 13
13 -
 14
14 -
 15
15 -
16
-
17
-
18
-
19
-
20
-
21
-
22
-
23
-
24
-
25
-
26
-
27
-
28
-
29
-
30
-
31
-
32
-
33
-
34
-
35
-
36
-
37
-
38
-
39
-
40
-
41
-
42
-
43
-
44
-
45
-
46
-
47
-
48
-
49
-
50
-
51
-
52
-
53
-
54
-
55
-
56
-
57
-
58
-
59
-
60
-
61
-
62
-
63
-
64
-
65
-
66
-
67
-
68
-
69
-
70
-
71
-
72
-
73
-
74
-
75
-
76
-
77
-
78
-
79
-
80
-
81
 |
 |

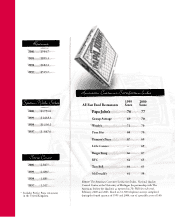
1999 2000
All Fast Food Restaurants Score Score
American Customer Satisfaction IndexAmerican Customer Satisfaction Index
Papa John’s 76 77
Group Average 69 70
Wendy’s 71 70
Pizza Hut 68 70
Domino’s Pizza 67 69
Little Caesars -- 69
Burger King 66 67
KFC 64 65
Taco Bell 64 63
McDonald’s 61 59
Source: The American Customer Satisfaction Index, National Quality
Control Center at the University of Michigan (in partnership with The
American Society for Quality), as reported in The Wall Street Journal,
February, 2000 and 2001. Based on 12,500 telephone surveys completed
during the fourth quarters of 1999 and 2000; out of a possible score of 100.
RevenuesRevenues
2000 $944.7
1999 $805.3
1998 $682.2
1997 $515.7
(MILLIONS)
System-Wide SalesSystem-Wide Sales
2000 $1,751.6
1999 $1,438.3
1998 $1,156.3
1997 $ 867.6
(MILLIONS)
Store CountStore Count
2000 2,817*
1999 2,486*
1998 1,885
1997 1,517
* Includes Perfect Pizza restaurants
in the United Kingdom.