PACCAR 2012 Annual Report Download - page 3
Download and view the complete annual report
Please find page 3 of the 2012 PACCAR annual report below. You can navigate through the pages in the report by either clicking on the pages listed below, or by using the keyword search tool below to find specific information within the annual report.-
 1
1 -
 2
2 -
 3
3 -
 4
4 -
 5
5 -
 6
6 -
 7
7 -
 8
8 -
 9
9 -
 10
10 -
 11
11 -
 12
12 -
 13
13 -
 14
14 -
15
-
16
-
17
-
18
-
19
-
20
-
21
-
22
-
23
-
24
-
25
-
26
-
27
-
28
-
29
-
30
-
31
-
32
-
33
-
34
-
35
-
36
-
37
-
38
-
39
-
40
-
41
-
42
-
43
-
44
-
45
-
46
-
47
-
48
-
49
-
50
-
51
-
52
-
53
-
54
-
55
-
56
-
57
-
58
-
59
-
60
-
61
-
62
-
63
-
64
-
65
-
66
-
67
-
68
-
69
-
70
-
71
-
72
-
73
-
74
-
75
-
76
-
77
-
78
-
79
-
80
-
81
-
82
-
83
-
84
-
85
-
86
-
87
-
88
-
89
-
90
-
91
-
92
-
93
-
94
 |
 |

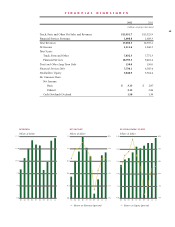
F I N A N C I A L H I G H L I G H T S
2012 2011
(millions except per share data)
Truck, Parts and Other Net Sales and Revenues $15,951.7 $15,325.9
Financial Services Revenues 1,098.8 1,029.3
Total Revenues 17,050.5 16,355.2
Net Income 1,111.6 1,042.3
Total Assets:
Truck, Parts and Other 7,832.3 7,771.3
Financial Services 10,795.5 9,401.4
Truck and Other Long-Term Debt 150.0 150.0
Financial Services Debt 7,730.1 6,505.4
Stockholders’ Equity 5,846.9 5,364.4
Per Common Share:
Net Income:
Basic $ 3.13 2.87
Diluted 3.12 2.86
Cash Dividends Declared 1.58 1.30
REVENUES
billions of dollars
STOCKHOLDERS ’ E Q U I T Y
billions of dollars
NET I N C O M E
billions of dollars
03 04 05 06 07 08 09 10 11 12
17.5
14.0
10.5
7.0
3.5
0.0
03 04 05 06 07 08 09 10 11 12
1.5
1.2
0.9
0.6
0.3
0.0
4%
6%
8%
10%
2%
0%
03 04 05 06 07 08 09 10 11 12
24%
32%
40%
8%
0%
1.2
6.0
4.8
3.6
2.4
0.0
16%
Return on Revenues (percent)
$
Return on Equity (percent)