PACCAR 2010 Annual Report Download
Download and view the complete annual report
Please find the complete 2010 PACCAR annual report below. You can navigate through the pages in the report by either clicking on the pages listed below, or by using the keyword search tool below to find specific information within the annual report.-
 1
1 -
 2
2 -
 3
3 -
 4
4 -
 5
5 -
 6
6 -
 7
7 -
 8
8 -
 9
9 -
 10
10 -
 11
11 -
 12
12 -
13
-
14
-
15
-
16
-
17
-
18
-
19
-
20
-
21
-
22
-
23
-
24
-
25
-
26
-
27
-
28
-
29
-
30
-
31
-
32
-
33
-
34
-
35
-
36
-
37
-
38
-
39
-
40
-
41
-
42
-
43
-
44
-
45
-
46
-
47
-
48
-
49
-
50
-
51
-
52
-
53
-
54
-
55
-
56
-
57
-
58
-
59
-
60
-
61
-
62
-
63
-
64
-
65
-
66
-
67
-
68
-
69
-
70
-
71
-
72
-
73
-
74
-
75
-
76
-
77
-
78
-
79
-
80
-
81
-
82
-
83
-
84
-
85
-
86
-
87
 |
 |

2 0 1 0 A N N U A L R E P O R T
Table of contents
-
Page 1
2 0 1 0 A N N U A L R E P O R T -
Page 2
... are employed in financial services activities. PACCAR manufactures and markets industrial winches under the Braden, Gearmatic and Carco nameplates. PACCAR maintains exceptionally high standards of quality for all of its products: they are well engineered, highly customized for specific applications... -
Page 3
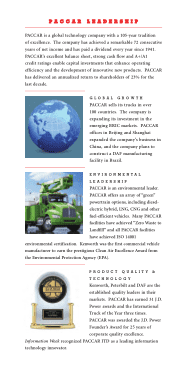
... BRIC markets. PACCAR offices in Beijing and Shanghai expanded the company's business in China, and the company plans to construct a DAF manufacturing facility in Brazil. E N V I R O N M E N TA L L E A D E R S H I P PACCAR is an environmental leader. PACCAR offers an array of "green" powertrain... -
Page 4
... share data) Truck and Other Net Sales and Revenues Financial Services Revenues Total Revenues Net Income Total Assets: Truck and Other Financial Services Truck and Other Long-Term Debt Financial Services Debt Stockholders' Equity Per Common Share: Net Income: Basic Diluted Cash Dividends Declared... -
Page 5
... good results from aftermarket parts and financial services. PACCAR's $407 million of capital investments and research and development in 2010 enhanced its manufacturing capability and new product introductions, such as PACCAR's MX engine for the North America market. PACCAR delivered 78,800 trucks... -
Page 6
... the highest-quality products and services in our history. The Peterbilt Nashville plant was sold to align production capacity with market demand. PACCAR's product quality continued to be recognized as the industry leader in 2010. Kenworth earned the J.D. Power Medium Duty Customer - Six Sigma is... -
Page 7
... for DAF dealers and customers in 16 European countries and financed 19% of DAF's vehicle sales in 2010. PACCAR Leasing (PacLease) had a good year and placed 4,000 new PACCAR vehicles in service in 2010. The North American lease market was stronger and PacLease Europe grew its lease and rental fleet... -
Page 8
... capital goods and financial services marketplace.  - PACCAR is a global environmental leader. A significant achievement was earning ISO 14001 environmental certification at all PACCAR manufacturing facilities in Europe and North America. DAF introduced its medium duty dieselelectric LF hybrid... -
Page 9
-
Page 10
... network with over 50 new dealer facilities opened. New locations were added in Western and Central Europe, Russia and South Africa. DAF began planning for the introduction of DAF vehicles in South America, including the construction of a manufacturing facility in Brazil. The DAF engine design... -
Page 11
-
Page 12
...The proprietary, fuel efficient PACCAR MX 12.9 liter engine was integrated into all Peterbilt heavy duty vehicles, providing customers longer service intervals, increased uptime and lower operating costs. Peterbilt launched the PACCAR MX engine with a North American Tour at 100 dealer locations with... -
Page 13
-
Page 14
... competitor. The driving performance and cab ergonomics are unequaled in the industry for productivity, luxury, storage and amenities. * Kenworth received the highest numerical score for medium-duty truck dealer service in the proprietary J.D. Power and Associates 2010 Medium Duty Truck Customer... -
Page 15
... DAF CF85 with a Euro 5 PACCAR MX 12.9 liter engine was introduced into the Australian market for regional transport customers. PACCAR Parts delivered record sales, and it expanded warehouse capacity by 20,000 square feet to meet growing demand and add new parts programs. PACCAR Australia's dealers... -
Page 16
... for regional delivery operations. Kenworth 2010 sales to Latin America more than doubled compared to 2009 with Kenworth's T460 and aerodynamic T660 vehicles gaining increased market share. KENMEX's 125 dealer locations offer the most extensive parts and service network in the country, a major... -
Page 17
... Kingdom's leading truck manufacturer, celebrated its twelfth  anniversary as a PACCAR company. Leyland delivered 9,200 DAF vehicles to customers in Europe, Australia, Africa and North America - a 15% increase over 2009. Leyland's highly efficient 710,000-square-foot manufacturing facility... -
Page 18
... luxury coach producers in Asia, winning best coach engine manufacturer honors at the Bus World Asia exhibition for the fourth year in a row in 2010. PACCINT expanded its global distribution network in 2010 by appointing nine new service locations in Russia, South Africa, and Singapore. The K500... -
Page 19
... by providing fleet customers with guaranteed national pricing, centralized billing and diagnostic scheduling of maintenance. With the launch of the PACCAR MX engine, PACCAR Parts expanded the PACCAR Call Center (PCC) in North America to offer 24/7 technical and diagnostic engine support. In an... -
Page 20
...,000-square-foot diesel engine production facility in Columbus, Mississippi, during 2010, producing the PACCAR MX 12.9 liter engine - the standard engine in Kenworth and Peterbilt vehicles. PACCAR developed and constructed two advanced engine factories and added 40 sophisticated engine test cells in... -
Page 21
... rates allowed PFS to support the sale of Kenworth, Peterbilt and DAF trucks in 20 countries on three continents. PFS achieved retail market share of 28% in 2010. PACCAR Financial Europe (PFE) has $1.9 billion in assets and is the leading financial services provider to DAF dealers and customers... -
Page 22
...-service lease segment helped DAF achieve a record share of the German truck market in 2010. PacLease provides customers with value-added transportation services and premium-quality Kenworth, Peterbilt and DAF vehicles. It is one of the fastest-growing and most innovative global leasing networks... -
Page 23
... DAF trucks. PACCAR Technical Centers in Europe and North America advance the quality and competitiveness of PACCAR products worldwide. Equipped with state-of-the-art product test and validation capabilities and staffed with technical experts in powertrain and vehicle development, these world-class... -
Page 24
..., financial services and engineering design. This year ITD partnered with the PACCAR Engine Company to implement integrated engineering, production and aftermarket systems for the North American launch of the PACCAR MX engine. ITD introduced new customer sales tools for dealers in Latin America... -
Page 25
... sales trucks (000) 325 14% 280 26% 260 12% 210 24% 195 10% 140 22% 130 8% 70 20% 65 6% 01 02 03 04 05 06 07 08 09 10 0 18% 01 02 03 04 05 06 07 08 09 10 0 â- Total Western and Central Europe >15T Units PACCAR Market Share (percent) â- Total U.S. and Canada Class 8 Units... -
Page 26
... The Peer Group Index consists of Caterpillar Inc., Cummins Inc., Danaher Corporation, Deere & Company, Dover Corporation, Eaton Corporation, Harley-Davidson, Inc., Honeywell International Inc., Illinois Tool Works Inc., Ingersoll-Rand Company Ltd. and United Technologies Corporation. The comparison... -
Page 27
... from financing or leasing PACCAR products in the U.S., Canada, Mexico, Europe and Australia. The Company's Other business is the manufacturing and marketing of industrial winches. Consolidated net sales and revenues were $10.29 billion in 2010, an increase from the $8.09 billion in 2009, due... -
Page 28
...conditions affecting the Company's results of operations. 2010 Compared to 2009: Truck PACCAR's Truck segment accounted for 90% and 86% of revenues in 2010 and 2009, respectively. 2010 2009 % change Truck net sales and revenues: U.S. and Canada Europe Mexico, Australia and other Truck income before... -
Page 29
...000 units in 2009. The Company's market share was 15.2% in 2010 compared to 14.8% in 2009. DAF market share in the 6- to 15-tonne market in 2010 was 7.7%, compared to 9.3% in 2009. The 6- to 15-tonne market in 2010 was 51,000 units, comparable to 2009. Net sales and revenues in Mexico, Australia and... -
Page 30
... and Canada. Factory overhead, warehouse and other indirect costs increased $89.7 million primarily due to higher supplies and maintenance ($38.6 million) and salaries and related costs ($16.5 million) to support higher production levels. Higher market demand also improved aftermarket parts sales... -
Page 31
... Financial Services 2010 2009 % change New loan and lease volume: U.S. and Canada Europe Mexico and Australia New loan and lease volume by product: Loans and finance leases Equipment on operating lease New loan and lease unit volume: Loans and finance leases Equipment on operating lease Average... -
Page 32
... offset by lower average debt and lower interest rates on borrowings. Operating lease, rental and other income 2009 Increase/(decrease) Operating lease impairments Losses on returned lease assets Used trucks taken on trade package Average operating lease assets Revenue and cost per asset Currency... -
Page 33
... significant at December 31, 2010 and 2009. The Company's 2010 pretax return on revenue for financial services increased to 15.9 % from 8.4% in 2009 primarily due to higher lease margin from lower operating lease impairments, a decline in losses on the sale of lease returns and a lower provision for... -
Page 34
... diluted share) of income tax expense from the retroactive effects of a new income tax law in Mexico. Truck PACCAR's Truck segment accounted for 86% and 90% of revenues in 2009 and 2008, respectively. 2009 2008 % change  Truck net sales and revenues: U.S. and Canada Europe Mexico, Australia... -
Page 35
...Net sales and revenues in Mexico, Australia and other countries outside the Company's primary markets declined to $.91 billion in 2009 from $2.10 billion in 2008 due to lower new truck deliveries reflecting lower overall market demand. The major factors for the change in net sales and revenues, cost... -
Page 36
... maintenance parts due to efforts by customers to limit costs during recessionary economic conditions. Truck R&D expenditures declined to $198.5 million in 2009 from $341.3 million in 2008, primarily due to lower spending on engine development and reduced spending for new vehicle development. Truck... -
Page 37
... Financial Services 2009 2008 % change New loan and lease volume: U.S. and Canada Europe Mexico and Australia New loan and lease volume by product: Loans and finance leases Equipment on operating lease New loan and lease unit volume: Loans and finance leases Equipment on operating lease Average... -
Page 38
... lease equipment ($9.9 million). There were lower gains on sales of trucks returned from leases ($9.1 million) and higher losses on sales of trucks returned from leases of $20.1 million due to lower used truck prices as a result of the global economic recession. In 2009, the Financial Services... -
Page 39
... and 2008. The Company's 2009 percentage pretax return on revenue for financial services decreased to 8.4% from 17.2% in 2008 primarily due to higher impairment charges and losses on the sale of operating lease assets and a higher provision for losses on receivables. Other Other includes the winch... -
Page 40
... new loan and lease originations of $507.0 million in the Financial Services segment compared to the prior year due to increased new truck demand. In addition, proceeds from asset disposals were $128.0 million lower in 2010, reflecting fewer used truck unit sales, and net purchases of marketable... -
Page 41
... 2011. Expenditures for property, plant and equipment in 2010 totaled $168.4 million compared to $127.7 million in 2009 as the Company increased its spending for new products. Over the last ten years, the Company's combined investments in worldwide capital projects and research and development... -
Page 42
... Financial Europe, had â,¬900 million available for issuance under a â,¬1.5 billion medium-term note program registered with the London Stock Exchange. The program was renewed in the fourth quarter of 2010 and is renewable annually through the filing of a new prospectus. In June 2008, PACCAR Mexico... -
Page 43
...provided by collections from customers on loans and lease contracts, as well as from the proceeds of commercial paper and medium-term note borrowings. Purchase obligations are the Company's contractual commitment to acquire future production inventory and capital equipment. Other obligations include... -
Page 44
... in government regulations and other factors outside the Company's control could impact the ultimate sales price of trucks returned under these contracts. Residual values are reviewed regularly and adjusted if market conditions warrant. A decrease in the estimated equipment residual values would... -
Page 45
... rates; changes in the levels of the Financial Services segment new business volume due to unit fluctuations in new PACCAR truck sales; changes affecting the profitability of truck owners and operators; price changes impacting equipment costs and residual values; insufficient supplier capacity... -
Page 46
...: 2010 2009 2008 43 (millions except per share data) Net sales and revenues Cost of sales and revenues Research and development Selling, general and administrative Curtailment gain Interest and other expense (income), net Truck and Other Income Before Income Taxes FINANCIAL SERVICES: $ 9,325... -
Page 47
... leases, net Property, plant and equipment, net Other noncurrent assets Total Truck and Other Assets $ 1,982.0 610.4 450.5 534.0 218.6 3,795.5 536.2 1,673.7 350.5 6,355.9 $ 1,836.5 554.7 219.5 632.1 224.3 3,467.1 503.8 1,757.7 409.1 6,137.7 FINANCIAL SERVICES: Cash and cash equivalents Finance... -
Page 48
...$1 par value - authorized 1.2 billion shares; issued 365.3 million and 364.4 million shares Additional paid-in capital Treasury stock, at cost - 2009 - .4 million shares Retained earnings Accumulated other comprehensive income Total Stockholders' Equity See notes to consolidated financial statements... -
Page 49
... receivables on new trucks Sales-type finance leases and dealer direct loans on new trucks Inventories Other, net Increase (decrease) in liabilities: Accounts payable and accrued expenses Residual value guarantees and deferred revenues Pension and post retirement contributions Other, net Net Cash... -
Page 50
...income Cash dividends declared on common stock, per share: 2010-$.69; 2009-$.54; 2008-$.82 Treasury stock retirement Balance at end of year ACCUMULATED OTHER COMPREHENSIVE INCOME (LOSS): Balance at beginning of year Other comprehensive income (loss) Balance at end of year Total Stockholders' Equity... -
Page 51
... heavy-duty commercial trucks and related aftermarket parts, "Truck" and (2) finance and leasing products and services provided to customers and dealers, "Financial Services". PACCAR's sales and revenues are derived primarily from North America and Europe. The Company also operates in Australia and... -
Page 52
... S December 31, 2010, 2009 and 2008 (currencies in millions) Revenue Recognition: Truck and Other: Substantially all sales and revenues of trucks and related aftermarket parts are recorded by the Company when products are shipped to dealers or customers, except for certain truck shipments that are... -
Page 53
..., 2009 and 2008, respectively. Financial Services: The Company continuously monitors the performance of all its finance receivables, by reviewing payment performance. In addition, for large customers and dealer wholesale financing accounts, the Company regularly monitors their financial statements... -
Page 54
...2010, 2009 and 2008 (currencies in millions) on the straight-line basis to the lower of the estimated residual value or guarantee value. Lease and guarantee periods generally range from three to seven years. Estimated useful lives of the equipment range from five to eight years. The Company reviews... -
Page 55
...239.3 $ 2,616.7 393.6 New Accounting Pronouncements: The Company adopted Accounting Standards Update (ASU) 2010-06 Improving Disclosures about Fair Value Measurements as of January 1, 2010 with no significant disclosure effect on the financial statements. The ASU requires disclosing the amounts of... -
Page 56
... for the years ended December 31, 2010, 2009 and 2008, respectively. The Company evaluates its investments in marketable securities at the end of each reporting period to determine if a decline in fair value is other than temporary. The fair value of marketable debt securities that have been in an... -
Page 57
... $6,497.7 The net activity of sales-type finance leases, dealer direct loans and wholesale financing on new trucks is shown in the operating section of the Consolidated Statements of Cash Flows since they finance the sale of Company inventory. Annual minimum payments due on finance receivables are... -
Page 58
... to monitor consists of retail with customers operating more thaninto five the trucks. others are owner/operator. All assess credit risk.accounts The Company's retail segment is subdivided fleetAll and owner/operator classes. Fleet impaired loans have a specific and operating are summarized as... -
Page 59
...ED F I NANC I AL S TAT E ME N T S December 31, 2010, 2009 and 2008 (currencies in millions) 56 Credit Quality The Company's customers are principally concentrated in the transportation industry in North America, Europe and Australia. On a geographic basis, there is a proportionate concentration... -
Page 60
... 2,090.8 (577.6) $1,513.2 Annual minimum lease payments due on Financial Services operating leases beginning January 1, 2011 are $393.6, $241.6, $152.0, $75.0, $17.4 and $3.0 thereafter. When the equipment is sold subject to an RVG, the full sales price is received from the customer. A liability is... -
Page 61
...S December 31, 2010, 2009 and 2008 (currencies in millions)  H . P R O D U C T S U P P O RT L I A B I L I T I E S Product support liabilities include reserves related to product warranties, optional extended warranties and repair and maintenance (R&M) contracts. The Company generally offers... -
Page 62
... 31, 2010, 2009 and 2008 the Company capitalized interest of $10.3, $2.3 and nil, respectively in Truck and Other. The primary sources of borrowings are commercial paper and medium-term notes issued in the public markets. The medium-term notes are issued by PACCAR Inc, PACCAR Financial Corp. (PFC... -
Page 63
...severance payments at December 31, 2010. During the years ended December 31, 2009 and 2008 the Company incurred severance costs of $25.9 and $17.3, respectively. These costs were the result of work force adjustments reflecting low truck demand, primarily in Europe. Employee Benefit Plans: PACCAR has... -
Page 64
... to all pension plans of the Company, except for certain multi-employer and foreign-insured plans: At December 31, 2010 2009 Weighted Average Assumptions: Discount rate Rate of increase in future compensation levels Assumed long-term rate of return on plan assets 5.4% 3.9% 7.2% 5.9% 3.9% 7.4% -
Page 65
... prior service cost are expected to be amortized into net pension expense in 2011. The accumulated benefit obligation for all pension plans of the Company, except for certain multi-employer and foreign-insured plans was $1,350.3 at December 31, 2010 and $1,214.0 at December 31, 2009. Information for... -
Page 66
... certain defined contribution benefit plans whereby it generally matches employee contributions up to 5% of base wages. The Company match was 3%, 1% and 5% in 2010, 2009 and 2008, respectively. The majority of participants in these plans are non-union employees located in the United States. Expenses... -
Page 67
... Company operates. Tax law requires items to be included in the Company's tax returns at different times than the items reflected in the Company's financial statements. As a result, the Company's annual tax rate reflected in its financial statements is different than that reported in its tax returns... -
Page 68
... as follows: At December 31, 2010 2009 65 Assets: Accrued expenses Net operating loss carryforwards Tax credit carryforwards Allowance for losses on receivables Postretirement benefit plans Other Valuation allowance Liabilities: Financial Services leasing depreciation Depreciation and amortization... -
Page 69
...ended December 31, 2010, 2009 and 2008. Amounts accrued for the payment of penalties and interest at December 31, 2010 and 2009 were also not significant. As of December 31, 2010, the United States Internal Revenue Service has completed examinations of the Company's tax returns for all years through... -
Page 70
... following table presents the balance sheet locations and fair value of derivative financial instruments: At December 31, ASSETS 2010 LIABILITIES 2009 assets liabilities Derivatives designated under hedge accounting: Interest-rate contracts: Financial Services: Other assets Deferred taxes and... -
Page 71
...2009 interest-rate contracts foreignexchange contracts (Gain) loss recognized in OCI: Truck and Other Financial Services Total $ (.2) $ 77.0 $ 77.0 $ (.2) $ 72.0 $ 72.0 $ $ (.6) .2 (.4) (Income) expense reclassified from Accumulated OCI into income: Truck and Other: Cost of sales and revenues... -
Page 72
... is based on quoted prices in active markets. These are categorized as Level 1. The fair value of non U.S. government bonds, municipal bonds, corporate bonds, asset-backed securities, commercial paper and term deposits is estimated using an industry standard valuation model, )hich is based... -
Page 73
...December 31, 2010, 2009 and 2008 (currencies in millions) 70 PACCAR's assets and liabilities subject to recurring fair value measurements are either Level 1 or Level 2 as follows: At December 31, 2010 LEVEL 1 LEVEL 2 TOTAL Assets: Marketable debt securities U.S. government securities U.S. tax... -
Page 74
... 31, 2010, 2009 and 2008 (currencies in millions) Other nonfinancial assets that are measured at fair value on a nonrecurring basis are as follows: At December 31, 2010 LEVEL 71 2009 2 level 2 Impaired loans: Financial Services Used trucks held for sale: Truck and Other Financial Services... -
Page 75
... price. The expected term is based on the period of time that options granted are expected to be outstanding based on historical experience. 2010 2009 2008 Risk-free interest rate Expected volatility Expected dividend yield Expected term Weighted average grant date fair value of options per share... -
Page 76
... in 2008 and 2007 at a weighted-average fair value of $43.61. These awards vest after five years if the Company's earnings per share growth over the same five year period meet or exceed certain performance goals. No matching shares were granted under this program in 2010 or 2009. The fair value of... -
Page 77
...in North America and Europe. The Financial Services segment is composed of finance and leasing products and services provided to truck customers and dealers. Revenues are primarily generated from operations in North America and Europe. Included in All Other is PACCAR's industrial winch manufacturing... -
Page 78
...2010, 2009 and 2008 (currencies in millions) Business Segment Data 2010 2009 2008 75 Net sales and revenues: Truck Less intersegment Net Truck All Other Truck and Other Financial Services... $ $ Segment assets: Truck Other Cash and marketable securities Financial Services 373.9 505.6 4.3 883.8... -
Page 79
... of the Public Company Accounting Oversight Board (United States). Those standards require that we plan and perform the audit to obtain reasonable assurance about whether the financial statements are free of material misstatement. An audit includes examining, on a test basis, evidence supporting the... -
Page 80
... opinion on the company's internal control over financial reporting based on our audit. We conducted our audit in accordance with the standards of the Public Company Accounting Oversight Board (United States). Those standards require that we plan and perform the audit to obtain reasonable assurance... -
Page 81
...DATA 78 2010 2009 2008 (millions except per share data) 2007 2006 Truck and Other Net Sales and Revenues Financial Services Revenues Total Revenues Net Income Net Income Per Share: Basic Diluted Cash Dividends Declared Per Share Total Assets: Truck and Other Financial Services Truck and Other... -
Page 82
...share data) Truck and Other: Net sales and revenues Cost of sales and revenues Research and development Financial Services: Revenues Interest and other borrowing expenses Depreciation and other (a) Net Income Net Income Per Share: Basic Diluted 2009... notes to the consolidated financial statements. -
Page 83
...the Company's sensitivity analysis, the potential loss in fair value for such financial instruments from a 10% unfavorable change in quoted foreign currency exchange rates would be a loss of $15.0 related to contracts outstanding at December 31, 2010, compared to a loss of $24.0 at December 31, 2009... -
Page 84
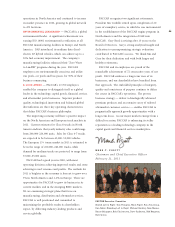
... Chairman Fluke Capital Management, L.P. (1, 3, 4) Kirk S. Hachigian Chairman and Chief Executive Officer Cooper Industries, plc (2) Stephen F. Page Retired Vice Chairman and Chief Financial Officer United Technologies Corporation (1, 4) Robert T. Parry Retired President and Chief Executive Officer... -
Page 85
... Kenworth Company Division Headquarters: Markborough Place I 6711 Mississauga Road N. Mississauga, Ontario L5N 4J8 Canada TRUCK PARTS AND SUPPLIES PACCAR FINANCIAL SERVICES GROUP PACCAR International Division Headquarters: PACCAR Building 777 106th Avenue N.E. Bellevue, Washington 98004 Offices... -
Page 86
... It is also available online at www.paccar.com/investors/ investor_resources.asp, under SEC Filings. Annual Stockholders' Meeting April 20, 2011, 10:30 a.m. Meydenbauer Center 11100 N.E. Sixth Street Bellevue, Washington 98004 An Equal Opportunity Employer This report was printed on recycled paper. -
Page 87