Omron 2015 Annual Report Download - page 9
Download and view the complete annual report
Please find page 9 of the 2015 Omron annual report below. You can navigate through the pages in the report by either clicking on the pages listed below, or by using the keyword search tool below to find specific information within the annual report.-
 1
1 -
 2
2 -
 3
3 -
 4
4 -
 5
5 -
 6
6 -
 7
7 -
 8
8 -
 9
9 -
 10
10 -
 11
11 -
 12
12 -
 13
13 -
 14
14 -
 15
15 -
 16
16 -
 17
17 -
 18
18 -
 19
19 -
 20
20 -
21
-
22
-
23
-
24
-
25
-
26
-
27
-
28
-
29
-
30
-
31
-
32
-
33
-
34
-
35
-
36
-
37
-
38
-
39
-
40
-
41
-
42
-
43
-
44
-
45
-
46
-
47
-
48
-
49
-
50
 |
 |

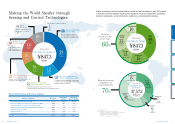
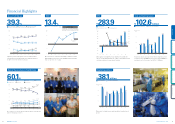
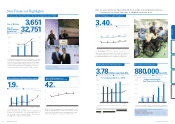
Financial Highlights
ROIC Cash and Cash EquivalentsGross Profit Margin
Ratio of Overseas Sales to Total Net Sales
EPS
Capital Expenditures
¥283.9
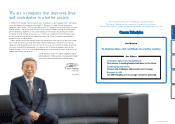
Omron paid a record-high ¥71 per-share dividend for fiscal 2014. We
expect to record a dividend payout ratio of 30% for fiscal 2015, achieving
our stated commitment one year ahead of schedule.
-150
0
150
100
50
250
200
-100
-50
300
0
40
20
60
80
100
120
1408 09 10 11 12 13
25.0%
71
FY
283.9
209.8
(Yen) (%)
Earnings per share
Cash dividends per share Dividend payout ratio
106.4%
24.7%
37.6%
27.0% 25.3%
-132.2
25 16.0 17
121.7
30
74.5
28
137.2
37 53
¥102.6
billion
We prioritize cash allocation to growth investments designed to achieve
our long-term vision (VG2020) goals. We forecast a total of ¥10 0 billion in
investments over the three years of our EARTH-1 STAGE plan.
0
60
90
30
120
1408 09 10 11 12 13
0
102.6102.6
53.0
46.646.6
36.6
51.751.7
45.5
74.774.7
18.8
45.345.3
5.6
0.5
55.755.7
90.390.3
FY
(Billions of yen)
Total interest-bearing liabilities
Cash and cash equivalents
(%)
Our expected cost of capital for the EARTH-1 STAGE is set at 6%.
ROIC management has led to fiscal 2014 ROIC significantly higher
than our expected cost of capital.
13.4
%
-10
0
5
10
-5
15
1408 09 10 11 12 13
-7.6
13.4
1.0
7.8
4.8
8.6
11.3
FY
Return on invested capital (ROIC)
Expected cost of
capital 6%
*Invested capital represents prior year-end actual
and average of current year quarterly forecasts
ROIC= Net Income
Invested Capital*
(Net Assets + Interest-Bearing Debt)
10.2
0.92.5
7.86.57.0
8.8
0
20
10
40
30
50
1408 09 10 11 12 13
39.339.3
23.4
34.8
34.8
26.225.4
23.023.523.4
6.85.7
7.77.2
6.76.76.2
23.5
35.1
35.1
37.5
37.536.836.837.137.138.5
38.5
(%)
FY
Significant growth in IAB segment revenues and profits drive
earnings improvement. Operating income margin breaks above
the
10% level for the first time in 25 years.
39.3
%
Selling, general and administrative expenses ratio (excluding R&D expenses)
R&D expenses ratio Operating income margin
Gross profit margin
(%)
We continue to see revenue growth in Greater China, Southeast Asia,
and other emerging economies.
60.1
%
Greater China
Japan
Asia Pacific
EuropeAmericas
Direct Exports
Overseas Total
0
40
50
30
20
10
60
1408 09 10 11 12 13
49.7
50.3 49.3
51.4
48.647.8
52.251.1
48.9
44.6
55.4
39.9
60.1
50.7
FY
12.8
12.0
6.4
2.01.91.61.8
2.07.6
1.6
16.414.8
11.7 12.0
15.7
8.1
13.7
12.1
16.3
8.5
13.5
16.3
8.4
12.413.1
18.4
1.5
9.3
21.4
9.8
12.8
14.6
14.7
¥38.1
billion
Omron plans to steadily increase capital expenditures toward sustained
growth.
0
20
30
10
40
1408 09 10 11 12 13
28.3
38.1
36.8
33.5
27.0
19.5
23.2 23.0
28.3
22.6
28.3
22.5
25.1
33.7
FY
(Billions of yen)
Depreciation and amortization
Capital expenditures
Integrated Report 2015 15
14 OMRON Corporation
About Omron Where We’re Headed Corporate Value Initiatives Corporate Value Foundation Financial Section