Omron 2015 Annual Report Download - page 10
Download and view the complete annual report
Please find page 10 of the 2015 Omron annual report below. You can navigate through the pages in the report by either clicking on the pages listed below, or by using the keyword search tool below to find specific information within the annual report.-
 1
1 -
 2
2 -
 3
3 -
 4
4 -
 5
5 -
 6
6 -
 7
7 -
 8
8 -
 9
9 -
 10
10 -
 11
11 -
 12
12 -
 13
13 -
 14
14 -
 15
15 -
 16
16 -
 17
17 -
 18
18 -
 19
19 -
 20
20 -
 21
21 -
22
-
23
-
24
-
25
-
26
-
27
-
28
-
29
-
30
-
31
-
32
-
33
-
34
-
35
-
36
-
37
-
38
-
39
-
40
-
41
-
42
-
43
-
44
-
45
-
46
-
47
-
48
-
49
-
50
 |
 |

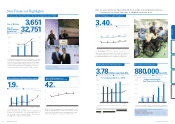
Note: The seven non-financial indices presented here have been reviewed by Deloitte Tohmatsu
Evaluation and Certification Organization, an independent evaluation entity.
3.78
million yen/ton-CO2
Net sales to CO2 emissions
225,000
200,000
(
ton-CO₂)
At Omron, we take pride in knowing that our businesses contribute to
a sustainable society. We track and improve global net sales to CO2
emissions and environmental contribution as two important indicators
of corporate value.
CO2 emissions of global production sites
*1 Net sales to CO2 emissions = Net sales per one ton of CO2 emissions.
0
150,000
125,000
175,000
0
5
4
3
2
1
(Million yen / ton-CO
₂)
10 11 12 13 14 20 (Target)FY
176,055
207,426
223,945
191,103 183,953
3.233.23 3.373.37 3.693.69 3.733.73 3.783.78
4.204.20
17% Improvement vs. 2010
880,000
ton-CO2
CO2 emissions of global production sites Environmental contribution
*2 Environmental Contribution = Volume of CO2 emissions reduction contributed by
society’s use of Omron Group’s energy saving, storage or generation products and services
.
Environmental Contribution > CO2 Emissions of Global Production Sites
10 11 12 13 14
FY
Targets Achieved for
Five Consecutive Years
0
400,000
200,000
600,000
800,000
1,000,000
671,953
207,426
216,467
191,103
211,364
183,953
331,222
176,055
880,561
223,945
(
ton-CO₂)
Environmental Contribution*2
Global Net Sales to CO2 Emissions*1
Ratio of Employees with Disabilities
See our website for more about how we calculate these figures.
Environmental Contribution
http://www.omron.com/about/csr/environ/eco_products/eco_contribution/
CO2 Emissions of Global Production Sites
http://www.omron.com/about/csr/environ/eco_fac_off_lab/co2_discharge/
data_co2exhaust_volume.html
Omron believes in diversity. As a matter of fact, diversity is a central tenet
of the Omron Principles. We continue to look for more opportunities to
provide disabled individuals a means to find pride in worthwhile work.
Note: Ratio of employees with disabilities (including special subsidiaries) is as of
June 30 each year.
3.40
%
Japanese national average
5
4
Employees with disabilities at Omron Corporation
0
2
1
3
(%)
10 11 12 13 14
FY
1.681.68 1.651.65 1.691.69 1.761.76 1.821.82
2.882.88 3.143.14 3.113.11 3.243.24 3.403.40
42
%
50
40
We believe that local management is the best management. This
is why we emphasize having local staff in key positions in our local
entities overseas. We will continue to train and appoint local staff
to perform managerial roles at our offices around the world.
0
20
10
30
11 12 13 14
FY
3131
3636
4242 4242
(%)
Ratio of Non-Japanese in
Managerial Positions Overseas
Practicing the Omron Principles (The Omron Global Awards: TOGA)
Ratio of Women in Managerial Roles (Japan)
For more about TOGA:
http://www.omron.com/about/csr/omron_csr/idea/practice/
No. of women in managerial roles
Ratio of women in managerial roles
1.9
%
(%)
(Women managers)
We are well aware that the low number of women in leadership roles
in Japan is not only critical issue—it's a lost opportunity. We plan to
raise the number of women in managerial roles to 3% by the end of
fiscal 2016 and to 5% by the end of fiscal 2018.
0
FY
4
2
6
40
0
20
10
30
12 13 14 15 16
(Target) 18
(Target)
1.4%
1.4%
2222 2323
2727
3030
1.5%
1.5%1.8%
1.8%
1.9%
1.9%
3.0%
3.0%
5.0%
5.0%
Note: Figures represent results as of April 20.
Challenging ourselves, being pioneers, putting ourselves in the shoes
of our customers. At Omron, we practice the Omron Principles as a
means to solve social issues as well as to become a more valuable
corporation. TOGA (The Omron Global Awards) recognizes teams
from around the world that have worked together to rise to the
challenge, delivering results that exemplify the Omron Principles.
No. of
Participating
Employees
32,75
1
No. of Entries
3,651
No. of participating employees No. of entries
12 13 14
FY
40,000
30,000
(Employees)
(Entries)
10,000
0 0
1,
000
2,
000
3,
000
4,
000
2,481
20,828
20,000
2,519
23,524
3,651
32,751
Non-Financial Highlights
Integrated Report 2015 17
16 OMRON Corporation
About Omron Where We’re Headed Corporate Value Initiatives Corporate Value Foundation Financial Section