Omron 2002 Annual Report Download - page 3
Download and view the complete annual report
Please find page 3 of the 2002 Omron annual report below. You can navigate through the pages in the report by either clicking on the pages listed below, or by using the keyword search tool below to find specific information within the annual report.-
 1
1 -
 2
2 -
 3
3 -
 4
4 -
 5
5 -
 6
6 -
 7
7 -
 8
8 -
 9
9 -
 10
10 -
 11
11 -
 12
12 -
 13
13 -
 14
14 -
15
-
16
-
17
-
18
-
19
-
20
-
21
-
22
-
23
-
24
-
25
-
26
-
27
-
28
-
29
-
30
-
31
-
32
-
33
-
34
-
35
-
36
-
37
-
38
-
39
-
40
-
41
-
42
-
43
-
44
-
45
-
46
-
47
-
48
-
49
-
50
-
51
-
52
 |
 |

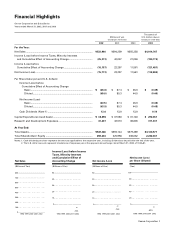
Net Sales
(Billions of Yen)
Income (Loss) before Income
Taxes, Minority Interests
and Cumulative Effect of
Accounting Change
(Billions of Yen)
Net Income (Loss)
(Billions of Yen)
Net Income (Loss)
per Share (Diluted)
(Yen)
0
100
200
300
400
500
600
700
800
1998 1999 2000 2001 2002
0
10
-25.4
20
30
40
50
1998 1999 2000 2001 2002
-15.8
0
10
20
30
40
50
1998 1999 2000 2001 2002
Financial Highlights
Omron Corporation and Subsidiaries
Years ended March 31, 2002, 2001 and 2000
Thousands of
Millions of yen U.S. dollars (Note 2)
(except per share data) (except per share data)
2002 2001 2000 2002
For the Year:
Net Sales .................................................................................................. ¥533,964 ¥594,259 ¥555,358 $4,014,767
Income (Loss) before Income Taxes, Minority Interests
and Cumulative Effect of Accounting Change................................... (25,373) 40,037 21,036 (190,774)
Income (Loss) before
Cumulative Effect of Accounting Change .......................................... (16,157) 22,297 11,561 (121,481)
Net Income (Loss).................................................................................... (15,773) 22,297 11,561 (118,594)
Per Share Data (yen and U.S. dollars):
Income (Loss) before
Cumulative Effect of Accounting Change
Basic ........................................................................................... ¥ (65.0) ¥ 87.4 ¥ 45.0 $ (0.49)
Diluted........................................................................................ (65.0) 85.3 44.5 (0.49)
Net Income (Loss)
Basic ........................................................................................... (63.5) 87.4 45.0 (0.48)
Diluted........................................................................................ (63.5) 85.3 44.5 (0.48)
Cash Dividends (Note 1) .................................................................. 13.0 13.0 13.0 0.10
Capital Expenditures (cash basis) .......................................................... ¥ 38,896 ¥ 37,583 ¥ 31,146 $ 292,451
Research and Development Expenses .................................................. 41,407 42,513 36,605 311,331
At Year End:
Total Assets.............................................................................................. ¥549,366 ¥593,144 ¥579,489 $4,130,571
Total Shareholders’ Equity ..................................................................... 298,234 325,958 336,062 2,242,361
Notes: 1. Cash dividends per share represent the amounts applicable to the respective year, including dividends to be paid after the end of the year.
2. The U.S. dollar amounts represent translations of Japanese yen at the approximate exchange rate at March 31, 2002, of ¥133=$1.
Omron Corporation 1
-63.5
0
20
40
60
80
100
1998 1999 2000 2001 2002