Olympus 2015 Annual Report Download - page 7
Download and view the complete annual report
Please find page 7 of the 2015 Olympus annual report below. You can navigate through the pages in the report by either clicking on the pages listed below, or by using the keyword search tool below to find specific information within the annual report.-
 1
1 -
 2
2 -
 3
3 -
 4
4 -
 5
5 -
 6
6 -
 7
7 -
 8
8 -
 9
9 -
 10
10 -
 11
11 -
 12
12 -
 13
13 -
 14
14 -
 15
15 -
 16
16 -
 17
17 -
 18
18 -
19
-
20
-
21
-
22
-
23
-
24
-
25
-
26
-
27
-
28
-
29
-
30
-
31
-
32
-
33
-
34
-
35
-
36
-
37
-
38
-
39
-
40
-
41
-
42
-
43
-
44
-
45
-
46
-
47
-
48
-
49
-
50
-
51
-
52
-
53
-
54
-
55
-
56
-
57
-
58
-
59
-
60
-
61
-
62
-
63
 |
 |

0
200
400
600
800
1,000
2011/3 2012/3 2013/3 2014/3 2015/3
847.1 848.5
743.9 713.3 764.7
2.9
(62.3)
8.3
(2.6)
5.7
(40)
(60)
(20)
20
0
3.9 8.0
(49.0)
(8.7)
13.6
2011/3 2012/3 2013/3 2014/3 2015/3
(50)
(25)
0
25
(75)
0
25
50
75
100
38.4 35.5
35.1
73.4
91.0
4.5 4.2
4.7
11.9
10.3
0
3
6
9
12
2011/3 2012/3 2013/3 2014/3 2015/3
0
20
40
60
80 67.3 61.4 63.4
74.1
66.8
2011/3 2012/3 2013/3 2014/3 2015/3
(50)
0
50
100
49.5
(4.8)
19.0
(35.7)
33.5
(39.6)
(20.3)
52.1
27.2
30.5 30.9 25.2
58.7 66.8
72.4
2011/3 2012/3 2013/3 2014/3 2015/3
0
300
900
600
1,200 1,019.2 966.5 960.2 1,081.6
115.6 48.0 151.9
357.3
1,027.5
331.3
2011/3 2012/3 2013/3 2014/3 2015/3
0
20
40
60
32.7 38.0
28.1
47.7
34.2 33.8 33.9
41.2
37.836.9
2011/3 2012/3 2013/3 2014/3 2015/3
11.0
4.6
15.5
32.9
32.1
0
10
20
30
40
2011/3 2012/3 2013/3 2014/3 2015/3
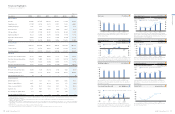
Net Sales 7% UP (YoY)
R&D Expenditures 11% UP (YoY)
Equity Ratio 0.8 point UP (YoY)
Free Cash Flows (Free CF) 48% DOWN (YoY)
(¥ Billion)
(¥ Billion) (%)
(¥ Billion) (¥ Billion)
(¥ Billion)
(¥ Billion) (¥ Billion)
Net sales were up 7% year on year following the second consecutive year of record-
breaking sales in the Medical Business and strong growth in overseas sales in the
Scientific Solutions Business.
Despite the rise in operating income and the lower financing costs accompanying reduced
interest-bearing debt, net loss was posted as a result of recording extraordinary loss in the
form of loss related to the investigation under U.S. Anti-kickback Act and the related Act.
Operating income increased 24% year on year following higher profits in the Medical
Business and the Scientific Solutions Business and the return to profitability in the Others
Business that was achieved by withdrawing from unprofitable businesses. As a result,
the operating margin rose 1.6 percentage points.
R&D expenditures were up 11% year on year due to proactive investments in fields
featuring future growth potential, primarily in the Medical Business. These expenditures
represented 10% of net sales.
Net cash provided by operating activities amounted to ¥66.8 billion. Net cash used in
investing activities totaled ¥39.6 billion, up as a result of investment for the redevelopment
of plants in the Medical Business. The result was positive free cash flow of ¥27.2 billion.
Total net assets increased 8% year on year as a result of significantly more beneficial
foreign currency translation adjustments that stemmed from yen depreciation.
Capital expenditures increased as a result of significantly higher expenditures in the
Medical Business. Consequently, depreciation and amortization rose, centered on the
Medical Business.
The equity ratio improved 0.8 percentage point following a ¥61.4 billion year-on-year
reduction in interest-bearing debt.
Net Income (Loss) ROE (right) Total Assets Total Net Assets
Operating Income Operating Margin (right)
Capital Expenditures Depreciation and Amortization
CF from Operating Activities CF from Investing Activities Free CF
(%)
(%)
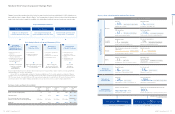
Millions of yen
Consolidated 2010/3 2011/3 2012/3 2013/3 2014/3 2015/3
Business Results
Net sales 883,086 847,105 848,548 743,851 713,286 764,671
Operating income 61,160 38,379 35,518 35,077 73,445 90,962
Operating margin (%) 6.9% 4.5% 4.2% 4.7% 10.3% 11.9%
Net income (loss) 52,527 3,866 (48,985) 8,020 13,627 (8,737)
R&D expenditures 61,850 67,286 61,356 63,379 66,796 74,101
Capital expenditures*134,323 32,699 37,961 28,109 37,810 47,743
Depreciation and amortization 43,099 34,188 33,787 33,899 36,850 41,219
EBITDA*2116,113 84,186 80,408 78,659 119,752 141,602
Financial Position
Total assets*31,104,528 1,019,160 966,526 960,239 1,027,475 1,081,551
Total net assets*3163,131 115,579 48,028 151,907 331,284 357,254
Interest-bearing debt 661,481 648,787 642,426 560,390 415,831 354,421
Cash Flows
Cash flows from operating activities 76,245 30,469 30,889 25,233 72,388 66,811
Cash flows from investing activities (20,967) 19,003 (35,735) 33,455 (20,273) (39,612)
Free cash flow*455,278 49,472 (4,846) 58,688 52,115 27,199
Cash flows from financing activities 17,355 (37,359) (5,761) (42,436) (39,693) (70,185)
Per Share Data
Net income (loss) per share (yen) 194.90 14.39 (183.54) 28.96 41.05 (25.53)
Total equity per share (yen) 576.63 421.37 167.76 493.30 962.83 1,038.64
Cash dividends per share (yen) 30 30 — — — 10
Financial Indicators
EBITDA margin*2 (%) 13.1% 9.9% 9.5% 10.6% 16.8% 18.5%
Return on equity (ROE) (%) 40.6% 2.9% (62.3%) 8.3% 5.7% (2.6%)
Return on assets (ROA) (%) 4.9% 0.4% (4.9%) 0.8% 1.4% (0.8%)
Equity ratio (%) 14.1% 11.0% 4.6% 15.5% 32.1% 32.9%
Price earnings ratio (PER)*5 (times) 15.4 160.8 — 76.4 80.2 —
Price book-value ratio (PBR) (times) 5.2 5.5 8.1 4.5 3.4 4.3
*1. Capital expenditures are calculated based on the definition of capital expenditure in accordance with ASBJ Statement No. 17 “Accounting Standard for Disclosures about Segments of
an Enterprise and Related Information.”
*2. EBITDA = Operating income + Depreciation and amortization that is included in cost of sales or SG&A expenses + Amortization of goodwill that is included in SG&A expenses
EBITDA margin = EBITDA / Net sales
*3. In line with the issuance of IAS No. 19 “Employee Benefits” (revised on June 16, 2011) to be applied for fiscal years beginning on or after January 1, 2013, certain overseas subsidiaries
adopted IAS No. 19 effective this fiscal year and changed their method of recognizing actuarial gain or loss. This change has applied retroactively to the figures for the fiscal year ended
March 31, 2013.
*4. Free cash flow = Cash flows from operating activities + Cash flows from investing activities
*5. Price earnings ratio (PER) for the fiscal years ended March 31, 2012 and 2015 are omitted as Olympus recorded net loss for these fiscal years.
Net Income (Loss) 164% DOWN (YoY)
ROE 8.3 points DOWN (YoY)
Total Assets 5% UP (YoY)
Total Net Assets 8% UP (YoY)
Capital Expenditures 26% UP (YoY)
Depreciation and Amortization 12% UP (YoY)
Operating Income 24% UP (YoY)
Operating Margin 1.6 points UP (YoY)
Financial Highlights
(For the fiscal years as of / ended March 31)
11
OLYMPUS Annual Report 2015
10 OLYMPUS Annual Report 2015
Overview of Olympus