Occidental Petroleum 2008 Annual Report Download - page 14
Download and view the complete annual report
Please find page 14 of the 2008 Occidental Petroleum annual report below. You can navigate through the pages in the report by either clicking on the pages listed below, or by using the keyword search tool below to find specific information within the annual report.-
 1
1 -
2
-
3
-
 4
4 -
 5
5 -
 6
6 -
 7
7 -
 8
8 -
 9
9 -
 10
10 -
 11
11 -
 12
12 -
 13
13 -
 14
14 -
 15
15 -
 16
16 -
 17
17 -
 18
18 -
 19
19 -
 20
20 -
 21
21 -
 22
22 -
 23
23 -
 24
24 -
25
-
26
-
27
-
28
-
29
-
30
-
31
-
32
-
33
-
34
-
35
-
36
-
37
-
38
-
39
-
40
-
41
-
42
-
43
-
44
-
45
-
46
-
47
-
48
-
49
-
50
-
51
-
52
-
53
-
54
-
55
-
56
-
57
-
58
-
59
-
60
-
61
-
62
-
63
-
64
-
65
-
66
-
67
-
68
-
69
-
70
-
71
-
72
-
73
-
74
-
75
-
76
-
77
-
78
-
79
-
80
-
81
-
82
-
83
-
84
-
85
-
86
-
87
-
88
-
89
-
90
-
91
-
92
-
93
-
94
-
95
-
96
-
97
-
98
-
99
-
100
-
101
-
102
-
103
-
104
-
105
-
106
-
107
-
108
-
109
-
110
-
111
-
112
-
113
-
114
-
115
-
116
 |
 |
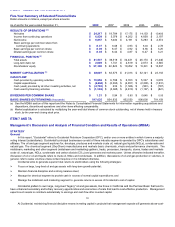
barrel on July 3, 2008, up from $95.98 per barrel as of December 31, 2007, and then dropped to $44.60 per barrel at the end of 2008. The
average WTI market price for 2008 was $99.65 per barrel compared with $72.32 per barrel in 2007. Occidental’s realized price for crude oil as
a percentage of average WTI prices was approximately 89 percent and 90 percent for 2008 and 2007, respectively. Prices and differentials can
vary significantly, even on a short-term basis, making it impossible to predict realized prices with a reliable degree of certainty.
12
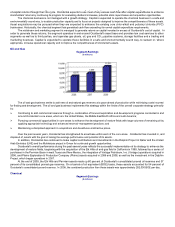
The average New York Mercantile Exchange (NYMEX) domestic natural gas price in 2008 increased approximately 27 percent from