OG&E 2009 Annual Report Download - page 8
Download and view the complete annual report
Please find page 8 of the 2009 OG&E annual report below. You can navigate through the pages in the report by either clicking on the pages listed below, or by using the keyword search tool below to find specific information within the annual report.-
 1
1 -
 2
2 -
 3
3 -
 4
4 -
 5
5 -
 6
6 -
 7
7 -
 8
8 -
 9
9 -
 10
10 -
 11
11 -
 12
12 -
 13
13 -
 14
14 -
 15
15 -
 16
16 -
 17
17 -
 18
18 -
 19
19 -
20
-
21
-
22
-
23
-
24
-
25
-
26
-
27
-
28
-
29
-
30
-
31
-
32
-
33
-
34
-
35
-
36
-
37
-
38
-
39
-
40
-
41
-
42
-
43
-
44
-
45
-
46
-
47
-
48
-
49
-
50
-
51
-
52
-
53
-
54
-
55
-
56
-
57
-
58
-
59
-
60
-
61
-
62
-
63
-
64
-
65
-
66
-
67
-
68
-
69
-
70
-
71
-
72
-
73
-
74
-
75
-
76
-
77
-
78
-
79
-
80
-
81
-
82
-
83
-
84
-
85
-
86
-
87
-
88
-
89
-
90
-
91
-
92
-
93
-
94
-
95
-
96
-
97
-
98
-
99
-
100
-
101
-
102
-
103
-
104
-
105
-
106
-
107
-
108
-
109
-
110
-
111
-
112
-
113
-
114
-
115
-
116
-
117
-
118
-
119
-
120
-
121
-
122
-
123
-
124
-
125
-
126
-
127
-
128
-
129
-
130
-
131
-
132
-
133
-
134
-
135
 |
 |

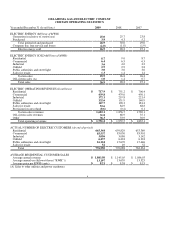
OKLAHOMA GAS AND ELECTRIC COMPANY
CERTAIN OPERATING STATISTICS
Year ended December 31 (In millions) 2009 2008 2007
ELECTRIC ENERGY (Millions of MWH)
Generation (exclusive of station use) 25.0 25.7 23.8
Purchased 3.9 4.3 5.2
Total generated and purchased 28.9 30.0 29.0
Company use, free service and losses (2.0) (1.8) (1.9)
Electric energy sold 26.9 28.2 27.1
ELECTRIC ENERGY SOLD (Millions of MWH)
Residential 8.7 9.0 8.7
Commercial 6.4 6.5 6.3
Industrial 3.6 4.0 4.2
Oilfield 2.9 2.9 2.8
Public authorities and street light 3.0 3.0 3.0
Sales for resale 1.3 1.4 1.4
System sales 25.9 26.8 26.4
Off-system sales (A) 1.0 1.4 0.7
Total sales 26.9 28.2 27.1
ELECTRIC OPERATING REVENUES (In millions)
Residential $ 717.9 $ 751.2 $ 706.4
Commercial 439.8 479.0 450.1
Industrial 172.1 219.8 221.4
Oilfield 132.6 151.9 140.9
Public authorities and street light 167.7 190.3 181.4
Sales for resale 53.6 64.9 68.8
Provision for rate refund (0.6) (0.4) 0.1
System sales revenues 1,683.1 1,856.7 1,769.1
Off-system sales revenues 31.8 68.9 35.1
Other 36.3 33.9 30.9
Total operating revenues $ 1,751.2 $ 1,959.5 $ 1,835.1
ACTUAL NUMBER OF ELECTRIC CUSTOMERS (At end of period)
Residential 665,344 659,829 653,369
Commercial 85,537 85,030 83,901
Industrial 3,056 3,086 3,142
Oilfield 6,437 6,424 6,324
Public authorities and street light 16,124 15,670 15,446
Sales for resale 52 49 52
Total 776,550 770,088 762,234
AVERAGE RESIDENTIAL CUSTOMER SALES
Average annual revenue $ 1,083.50 $ 1,145.05 $ 1,086.03
Average annual use (kilowatt-hour (“KWH”)) 13,197 13,659 13,325
Average price per KWH (cents) $ 8.21 $ 8.38 $ 8.15
(A) Sales to other utilities and power marketers.
4