Nucor 2011 Annual Report Download - page 5
Download and view the complete annual report
Please find page 5 of the 2011 Nucor annual report below. You can navigate through the pages in the report by either clicking on the pages listed below, or by using the keyword search tool below to find specific information within the annual report.-
 1
1 -
 2
2 -
 3
3 -
 4
4 -
 5
5 -
 6
6 -
 7
7 -
 8
8 -
 9
9 -
 10
10 -
 11
11 -
 12
12 -
 13
13 -
 14
14 -
 15
15 -
 16
16 -
17
-
18
-
19
-
20
-
21
-
22
-
23
-
24
-
25
-
26
-
27
-
28
-
29
-
30
-
31
-
32
-
33
-
34
-
35
-
36
-
37
-
38
-
39
-
40
-
41
-
42
-
43
-
44
-
45
-
46
-
47
-
48
-
49
-
50
-
51
-
52
-
53
-
54
-
55
-
56
-
57
-
58
-
59
-
60
-
61
-
62
-
63
-
64
-
65
-
66
-
67
-
68
-
69
-
70
-
71
-
72
-
73
-
74
-
75
-
76
-
77
-
78
-
79
-
80
-
81
-
82
 |
 |

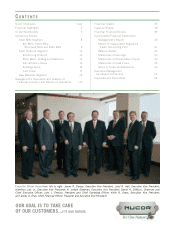
4
This disappointing economic performance is not surprising. Our nation has failed to implement real solutions to eliminate the unsustainable
structural imbalances that are dragging our economy deeper and deeper into a hole of little or no growth and crushing debt.
Under these extreme conditions, the Nucor team was still able to achieve a significant improvement in earnings compared with
2010. Our objective is to deliver improved returns at every point in the economic cycle. We call it delivering higher highs and
higher lows. In the last major economic slump, from 2001 through 2003, Nucor had a total net earnings of $339.8 million. During
the even deeper slump of 2009 through 2011, Nucor earned $618.7 million, an increase of 82%. The most recent peak to peak
earnings grew from $310.9 million in 2000 to $1.83 billion in 2008, an increase of 489%. We expect to see the full benefits of the
$7 billion in investments made from 2007 through
2011 (and what we will be investing in 2012 and
2013) during the next cyclical peak in the economy.
This continual improvement, supported by our
dedicated Nucor teammates and unique culture,
has helped us deliver superior returns to our
stockholders. From September 6, 2000, when Nucor’s new generation of leadership was put in place, through the end of 2011, Nucor
delivered a total return of 463.9%, compared with 173.9% for Standard & Poor’s Steel Group Index and 4.3% for the S&P 500.
This performance did not come without significant investment in our growth and continuous improvement initiatives of roughly $10
billion — or without our strong efforts to hold our global trading “partners” accountable to both the U.S. and WTO trading rules. We
have no doubt that our performance would have been significantly better if all of our nation’s global trading partners abided by these
rules without having to be forced.
Nucor uses each economic downturn as an opportunity to grow stronger. We use the good times to prepare for the bad, and we
use the bad times to prepare for the good. Emerging from downturns stronger than we enter them is how we build long-term value
for our stockholders. We get stronger because our team is focused on continual improvement and because our financial strength
allows us to invest in attractive growth opportunities throughout the economic cycle.
At the end of 2011, cash, short-term investments and restricted cash totaled $3.15 billion. In December 2011, we entered into a
new five-year revolving credit facility. The new $1.5 billion facility is undrawn at year end and expires in December 2016. We have
no commercial paper outstanding. Long-term debt totaled $4.3 billion for a gross debt to capital ratio of 36%. Looking ahead, our
debt to capital ratio is expected to decline as a result of upcoming long-term debt maturities of $650 million in 2012 and $250
million in 2013. We expect to fund those maturities
by drawing on our healthy liquidity position and
continued strong operating cash flows.
Standard & Poor’s (S&P), in its January 9, 2012 report
“North American Metals and Mining Companies,
Strongest to Weakest,” again ranked Nucor #1 for
credit rating and credit outlook among a universe of 68
companies. Nucor was also the only metals and mining company in the group that S&P awarded a strong business risk profile due to our
competitive position and profit performance relative to our peers.
Preparing for Growth
From this position of financial strength, we continue to successfully execute on our five-pronged growth strategy, even in the midst
of a down economy. That strategy, in short, is:
• Optimizeandcontinuouslyimproveourexistingoperationsandourteammates.
• Executeandgrowourrawmaterialsstrategy.
• Expandthroughgreenfieldgrowth,takingadvantageofnewtechnologyanduniquemarketniches.
• Seekinternationalgrowthviajointventures.
• Growthroughstrategicacquisitions.
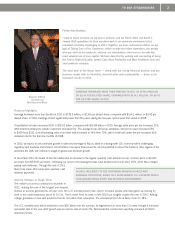
IN THE LAST MAJOR ECONOMIC SLUMP, FROM 2001 THROUGH 2003,
NUCOR HAD A TOTAL NET EARNINGS OF $339.8 MILLION. DURING
THE EVEN DEEPER SLUMP OF 2009 THROUGH 2011, NUCOR EARNED
$618.7 MILLION, AN INCREASE OF 82%.
FROM SEPTEMBER 6, 2000, WHEN NUCOR’S NEW GENERATION OF
LEADERSHIP WAS PUT IN PLACE, THROUGH THE END OF 2011, NUCOR
DELIVERED A TOTAL RETURN OF 463.9%, COMPARED WITH 173.9% FOR
STANDARD & POOR’S STEEL GROUP INDEX AND 4.3% FOR THE S&P 500.