North Face 2011 Annual Report Download - page 22
Download and view the complete annual report
Please find page 22 of the 2011 North Face annual report below. You can navigate through the pages in the report by either clicking on the pages listed below, or by using the keyword search tool below to find specific information within the annual report.-
 1
1 -
2
-
3
-
4
-
5
-
6
-
7
-
8
-
9
-
10
-
11
-
 12
12 -
 13
13 -
 14
14 -
 15
15 -
 16
16 -
 17
17 -
 18
18 -
 19
19 -
 20
20 -
 21
21 -
 22
22 -
 23
23 -
 24
24 -
 25
25
 |
 |
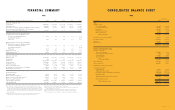
In thousands 2011
Assets
Cash and equivalents $ 341,228 ,
Accounts receivable, net 1,120,246 ,
Inventories 1,453,645 ,,
Deferred income taxes 106,717 ,
Other current assets 166,108 ,
Total current assets 3,187,944 ,,
, 737,451 ,
2,958,463 ,,
2,023,460 ,,
405,808 ,
$ 9,313,126 ,,
Liabilities and Stockholders’ Equity
Short-term borrowings $ 281,686 ,
Current portion of long-term debt 2,744 ,
Accounts payable 637,116 ,
Accrued liabilities 744,486 ,
Total current liabilities 1,666,032 ,,
- 1,831,781 ,
1,290,138 ,
’
Common Stock 110,557 ,
Additional paid-in capital 2,316,107 ,,
Accumulated other comprehensive income (loss) (421,477) (,)
Retained earnings 2,520,804 ,,
Total equity attributable to VF Corporation 4,525,991 ,,
Noncontrolling interests (816)
Total stockholders’ equity 4,525,175 ,,
$ 9,313,126 ,,
|
(1) Operating results for 2010 include a noncash charge for impairment of goodwill and intangible assets—$201.7 million
(pretax) in operating income and $141.8 million (aftertax) in income from continuing operations and net income attributable
to VF Corporation, $1.30 basic earnings per share and $1.29 diluted earnings per share. Operating results for 2009 include
a noncash charge for impairment of goodwill and intangible assets—$122.0 million (pretax) in operating income and $114.4
million (aftertax) in income from continuing operations and net income attributable to VF Corporation, $1.03 basic and
diluted earnings per share.
(2) Dividends per share divided by the total of income from continuing and discontinued operations per diluted share
(excluding the effect of the charge for impairment of goodwill and intangible assets in 2010 and 2009).
(3) Total capital is defined as stockholders’ equity plus short-term and long-term debt.
(4) Operating statistics are based on continuing operations (excluding the effect of the charges for impairment of
goodwill and intangible assets in 2010 and 2009).
(5) Invested capital is defined as average stockholders’ equity plus average short-term and long-term debt.
(6) Return is defined as income from continuing operations before net interest expense, after income taxes.
(7) Information presented for 2010 and 2009 excludes the impairment charge for goodwill and intangible assets.
|
Dollars and shares in thousands, except per share amounts 2011
()
Total revenues $ 9,459,232 ,, ,, ,, ,,
Operating income 1,244,791 , , , ,
Income from continuing operations attributable to VF Corporation 888,089 , , , ,
Discontinued operations attributable to VF Corporation - - - - (,)
Net income attributable to VF Corporation 888,089 , , , ,
Earnings (loss) per common share attributable to
VF Corporation common stockholders—basic
Income from continuing operations $ 8.13 . . . .
Discontinued operations – – – – (.)
Net income 8.13 . . . .
Earnings (loss) per common share attributable to
VF Corporation common stockholders—diluted
Income from continuing operations $ 7.98 . . . .
Discontinued operations – – – – (.)
Net income 7.98 . . . .
Dividends per share 2.61 . . . .
Dividend payout ratio () () 32.7% . . . .
Working capital $ 1,521,912 ,, ,, ,, ,,
Current ratio 1.9 . . . .
Total assets $ 9,313,126 ,, ,, ,, ,,
Long-term debt 1,831,781 , , ,, ,,
Stockholders’ equity 4,525,175 ,, ,, ,, ,,
Debt to total capital ratio () 31.9% . . . .
Average number of common shares outstanding 109,287 , , , ,
Book value per common share $ 40.93 . . . .
()
Operating margin () 13.2% . . . .
Return on invested capital () () () 15.8% . . . .
Return on average stockholders’ equity () () 22.0% . . . .
Return on average total assets () () 11.9% . . . .
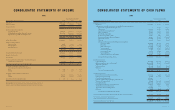
Cash provided by operations $1,081,371 ,, , , ,
Cash dividends paid 285,722 , , , ,